Global flight-path maps: Five interpretations
- Published
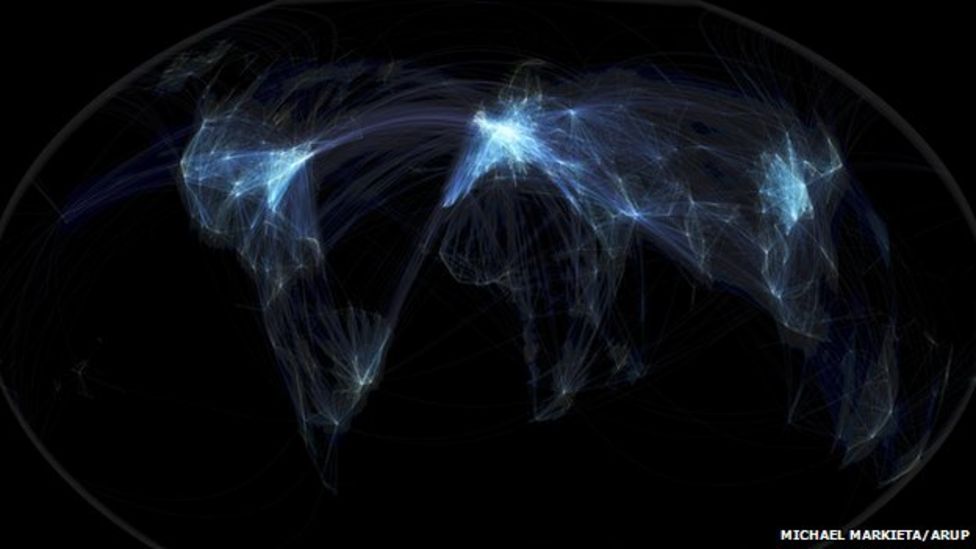
Michael Markieta's images depicting flight paths across the planet attracted huge interest from our readers. What do the maps reveal? We asked five experts to give their interpretation.
The art critic
Estelle Lovatt, estellelovatt.com
Wow, it's beautiful. It is not only dealing with two-dimensionality, it's trying to create three dimensions, or four dimensions - giving you a notion that you are travelling across the surface of this image.
It's almost like contemporary fractalisation - based on fractals, those beautiful divisions of science and nature. A number of artists have exploited them. Max Ernst based a lot of his surreal landscapes on fractalisation.

I would definitely exhibit these images. They give a great sense of movement and space. I think if Mark Rothko were alive today, he would be extremely inspired by this. Rothko's half-grey and half-black paintings are sometimes thought of as purely abstract, but he was painting them at the time of the Moon landings.
One of the things artists have to do today is to keep up with contemporary visual imagery. They have to embrace modern technology, and an artwork does not just have to be oil on linen in a gilt, beautiful fixed frame. It has to be "of the time" - these are of the time and beautiful abstract shapes, very sensitively done.
The environmentalist
Bill Hemmings, aviation and shipping programme manager at Transportenvironment.org
When you see the three brightest patches - Europe, North America, and East Asia - you are seeing the three main focuses of aviation emissions. I am surprised that the Transatlantic flights do not show up as brighter because emissions are intense there as well.
The images re-affirm what we already know. Between 1974 and 2009, cumulatively, Europe was responsible for 38% of aviation traffic, Asia/Pacific was responsible for 29%, and North America for 20%.
In climate change talks, there is a lot of discussion about historical responsibility - the countries where the industrial revolution took place centuries ago bear the greatest responsibility. But in aviation it's different. Long-haul flights, the source of most emissions, began in the 1970s, and we see that Asia is not that far behind. Not just China, but Thailand, Malaysia, Japan, Korea, and Australasia all carry a heavy responsibility.
You can see the three main areas of the world producing aviation emissions. They should take the lead in reducing them.
The aviation consultant
John Strickland, JLS Consulting

Europe looks so bright because it has so many short-haul flights. It's also one of the busiest global markets and there are several hubs in relatively close proximity in Europe: Paris, Frankfurt, Amsterdam and London.
You can very clearly make out American hubs like Atlanta, Dallas, Houston and Denver - there's a saying in the US that whether you go to heaven or hell, you have to go via Atlanta.
The map doesn't quite reflect that the actual routes change from day to day, depending on variables like wind direction, air traffic control charges and fuel costs.
But you can see where things are changing. Asia is really dense with flight paths. In China you have a rising middle class travelling for business and leisure.
What we're going to see in a few years is more connections between Asia and Africa, and South America and Africa, along with more "south-south" trade.
The data visualisation expert
Damien McCloud, geographic information systems, Arup
Visualisations like this are great. This is very clean and very simple and it gives an instant narrative. But my concern is that there's a tendency to over-interpret these kinds of pictures. This is a snapshot.
You can see the density of the flights, but it doesn't show you how many people are travelling on them. You could do that by colouring them differently.
Speaking as someone who got caught up in Hurricane Sandy last year, it would be good if you could overlay the map and show which flights are vulnerable to environmental risks.
The first thing you see is that there are three global hubs - the US, Europe and South-east Asia. If you were to overlay the major cities of the world it would show you most of them.
If you were coming from another planet and you were looking at this, you might think there weren't many people living in Africa or Latin America.
The philosopher
Mark Vernon
It looks like a strange life-form, like seeing translucent plankton in the sea, lighting up in certain parts... and you wonder what's going on in the darker parts, what kind of life, or activity, is concealed.
We are not seeing the life of individual human beings, but the life of the species as a whole, as if the species was one organism, pulsating like a jellyfish. Maybe it represents our collective existence?
Because of the darkness, it's like a side of ourselves that no individual can control or understand. It feels like a dream - the collective unconscious perhaps.
In the images where the lights are denser, there is something a bit entangled and manic. It's not completely peaceful. It's beautiful, but when you start to look, it's mad - a mad spider's web, slightly psychotic.
- Published28 May 2013