Cryosat tracks Arctic sea ice freeze-up
- Published

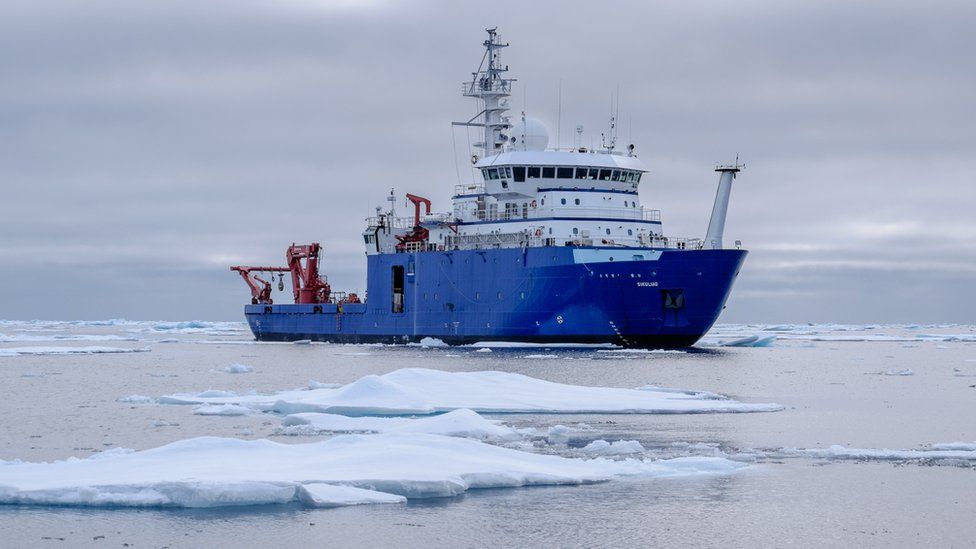
Maritime activities in the Arctic need thickness/volume data to stay safe
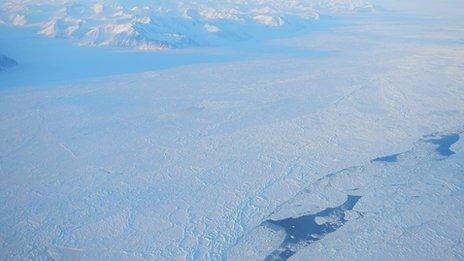
Arctic sea-ice volume during the first two weeks of October was about 6,200 cubic km.
The number comes from Europe's Cryosat mission, which has just restarted its near-real-time data service, external.
It is slightly higher than for the same period in 2010, but 1,500 cu km below the 2013 high point seen by the space sensor, now in its sixth year in orbit.
A rapid data feed is aimed at those sectors that need to be aware of the position of the most robust floes.
These include shipping and oil and gas operations.
Users can get snapshots of the Arctic basin covering two days, two weeks or one month.
New data is added just a couple of days after being acquired by the spacecraft and its radar instrument.

Volume of Arctic autumn sea ice: First two weeks of October (average)
2010: 5,900 cubic km; 2011: 4,500 cu km; 2012: 4,600 cu km;
2013: 7,800 cu km; 2014: 6,800 cu km; 2015: 6,200 cu km
Cryosat first introduced the service in April, but then had to suspend it in May because its complex, three-dimensional measurement technique of sea-ice thickness does not work in the peak of the summer melt season.
Now, with the autumn freeze-up well under way, the observations can be made again.
But even though Cryosat cannot produce reliable numbers in July, August and September, its early October figure is still a useful gauge of what happened during the summer period.
And this year's Crysosat volume measurement agrees well with the assessment, published by other satellite teams, of the area, or extent, of sea ice. This is a plain two-dimensional measurement that is much easier to make from orbit, even in the warmest months.
It witnessed the floating pack decline to a minimum of 4.41 million sq km by mid-September - the fourth lowest extent in the satellite era.
"Similarly, our number for volume in early October is our fourth lowest, but you have to remember that with Cryosat we've only got six years of data, whereas for the extent measurement the satellite record goes back several decades," explained Rachel Tilling from the Nerc Centre for Polar Observation and Modelling (CPOM) at University College London, UK.
Her CPOM colleague from Leeds University, Andy Shepherd, added: "Volume and extent seem to be tracking each other relatively closely of late, but going forward you might expect to see more variability in area than thickness, simply because natural variability from year to year can change quite quickly the amount of thin ice that is grown or melted in the Arctic."

The Cryosat radar mission was launched in April 2010
Climate models forecast a general downward trend in sea-ice cover in the northern polar region as temperatures rise.
CPOM research has shown that floe volume correlates well with "melt degree days" - essentially, the number of days in a year when air temperatures are sufficiently warm to erode the ice.
And, at the moment, the long-term trend sees this index increasing by about a quarter of a day, year on year.
Cryosat is a mission of the European Space Agency.
It carries one of the highest-resolution synthetic aperture radars ever put in orbit.
The instrument sends down pulses of microwave energy that bounce off both the top of the Arctic sea ice and the water in the cracks, or leads, that separate the floes.
By measuring the difference in height between these two surfaces, it is possible to calculate a thickness based on the known fraction of floating ice that is normally submerged.
A map of thickness points can then be converted into a volume when combined with data on sea-ice extent.
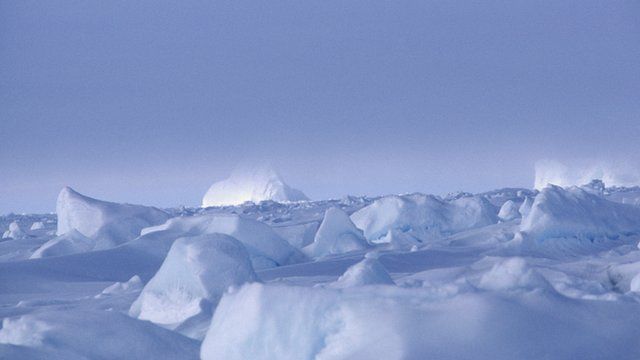
The technique becomes problematic in summer months because melt water sitting on the tops of floes looks the same to the radar as the seawater in the leads.
How Cryosat measures sea-ice volume

Cryosat's radar has the resolution to see the Arctic's floes and leads
Some 7/8 of the ice tends to sit below the waterline - the draft
The aim is to measure the freeboard - the ice part above the waterline
Knowing this 1/8th figure allows Cryosat to work out sea-ice thickness
The thickness multiplied by the area of ice cover produces a volume
Volume - not area - is the best guide to the status of Arctic sea ice
Cryosat's measurement technique works in autumn, winter and spring
Melt ponds on the ice make a mid-summer assessment very difficult
Jonathan.Amos-INTERNET@bbc.co.uk, external and follow me on Twitter: @BBCAmos, external
- Published28 September 2015
- Published21 July 2015
- Published17 April 2015
- Published15 December 2014


