Building alerts on BBC iPlayer audio and video consumption

Daniel Harper
Software Engineer
Tagged with:
The Analytics team based within the Online Technology Group are working on solutions to bring insights into BBC iPlayer Audio and Video (A/V) distribution and consumption. This helps to drive decisions and react quickly to service level problems as they occur. Software Engineer Daniel Harper shares insights into one of those solutions, based around making BBC iPlayer as stable as possible.
This blog post discusses how we set out to answer the following questions: are all of our BBC viewers using the iPlayer able to view content right now and how can we alert operations teams quickly when problems happen? In the text below, you will find out how we use cloud technologies combined with existing infrastructure to help us achieve these goals.
Background
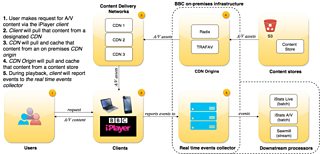
When users of the iPlayer request and receive content, diagnostic events such clicking “play” on a video stream, sending playing heartbeats and recording playback errors are collected in real-time.
These events are consumed by internal analytics services such as iStats Live, helping us to identify problems with distribution from Content Delivery Networks (CDNs) and track long-term trends, but these systems don’t offer the ability to alert us on outages.
A/V Distribution at the BBC
What we needed was a system that could monitor the active user count of all our streams and alert operations teams quickly. This presented us with a number of challenges:
- How can we keep up with the large quantity of data arriving from our users (Throughput)? Imagine a pipe flushing water at high pressure - we need something to handle at least 4,000 events per second, but with headroom to accept more.
- How can we analyse the data and inform operations teams quickly when problems occur (Latency)? We’d like something that can react within 1 minute of the event occurring.
- How can we allow operations teams to visualise what is happening when they are alerted? We’d like operations teams to be able to visualise the results on graphs.
Investigation
Receiving lots of data, analysing it and taking actions on the results is not a unique problem; there are many open and proprietary systems that give you the frameworks or pluggable components necessary to achieve your aims. For example, open source technologies like Apache Storm with Kafka have the features to solve our throughput and latency challenges. Additionally, cloud services like Kinesis with Lambda, Dataflow and Stream Analytics offer managed services that you can build on top of.
When it came to deciding how to implement our solution, the decisions came down to weighing up the balance between operational cost and ease of development. Hosting these components ourselves would mean having to set up and maintain them as resilient systems, whereas using managed services - in theory - allows you to focus on the problem at hand.
We were leaning towards using managed services for our implementation, and deciding between the ones we identified involved solving the third challenge; visualising and alerting. A crucial element of that was the need to support sending alerts to the existing monitoring platform used by our operations teams. The platform already supported receiving alarms from Cloudwatch, so this felt like a natural choice in comparison to having to spend time building a resilient visualisation and alerting system ourselves.
With that in mind, we settled on the following technology stack
- For throughput and latency, Kinesis and Lambda
- For visualisation and alerting Cloudwatch
These decisions ultimately led to what became Sawmill.
Introducing Sawmill
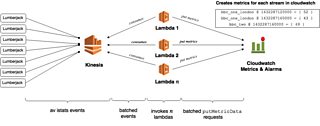
In contrast to iStats Live, which processes data in batches, Sawmill is a stream processing service designed to monitor the number of viewers across our live channels on the iPlayer as they arrive from our users. It pushes timestamped event data from Lumberjack, our real time events collector, into Kinesis and uses Lambda to aggregate them to the nearest minute and compute metrics that are pushed into CloudWatch.
Sawmill architecture
Events are collected and pushed to Kinesis via td-agent, a packaged version of fluentd, in combination with the plugin aws-fluent-plugin-kinesis that we have installed across all Lumberjack servers.
As the data arrives, Sawmill consumes them via Lambda in batches of around 1000 events each, and the processing logic can be visualised as filtering out irrelevant events and grouping them by the timestamp they occurred, to the nearest minute and channel.
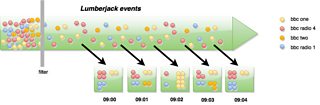
Sawmill grouping logic
Once the data is in Cloudwatch, we can view the graphs that describe stream counts for all of our channels.
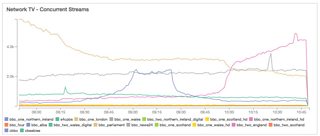
Graph displaying stream counts in CloudWatch for our Network TV
Monitoring and alerting
With this data, we make use of CloudWatch alarms to alert operations teams when the count for a stream dips below a fixed minimum threshold. We've already seen some successes with this approach, by being able to identify audience impact promptly when the BBC World Service audio became unavailable to some users for a brief period.
Some statistics
Right now we are:
- Collecting stream metrics for all 86 live radio and video channels.
- At a rate of 4000-7000+ events a second depending on peak traffic.
- Processed in batches of ~8 Lambda functions, each completing in < 100ms.
- Available for monitoring and alerting in CloudWatch after 1 minute.
As the accuracy of the data in Sawmill needs to be very high, we take pride in ensuring it is highly available and as accurate as possible. We’re pleased to say that at the time of writing Sawmill has been running in production for three months with 99.9999% data availability.
Moving forward
We’re excited to continue working on Sawmill, with the evolution of the product covering:
- Using more sophisticated data analysis and machine learning techniques such as anomaly detection using historical data to detect unusual patterns in user behaviour.
- Tracking cumulative and per-stream trend analysis.
- Making our per-stream alerting feature dynamic rather than fixed.
- Storing raw event data into S3 to enable us and other teams in the BBC for offline processing via MapReduce or other processing mechanisms.
- Support on-demand streams alongside live simulcast.
- Getting clients to submit events directly to Kinesis rather than Lumberjack.
We hope this gives you an insight into how we've been tackling real time monitoring of A/V consumption here at the BBC and the technologies we’ve used to achieve it, and hopefully given a taste of what’s next to come.
If you feel like these challenges are a good fit for you, we are hiring, so do get in touch.