Climate change: Which vegan milk is best?
- Published
- comments

The popularity of vegan foods continues to grow, with January seen as a traditional time to consider giving them a try.
Milk alternatives, such as oat, soy, almond or coconut, are one area of interest, with sales rising in the UK.
A scientific study suggests the greenhouse gas emissions used in the production of plant-based milks are lower than for dairy milk.
But which milk has the smallest impact on the planet?
Looking at the global averages illustrated in the chart below, producing a glass of dairy milk results in almost three times the greenhouse gas emissions of any non-dairy milks, according to a University of Oxford study.
Looking at land use, the difference is starker still.
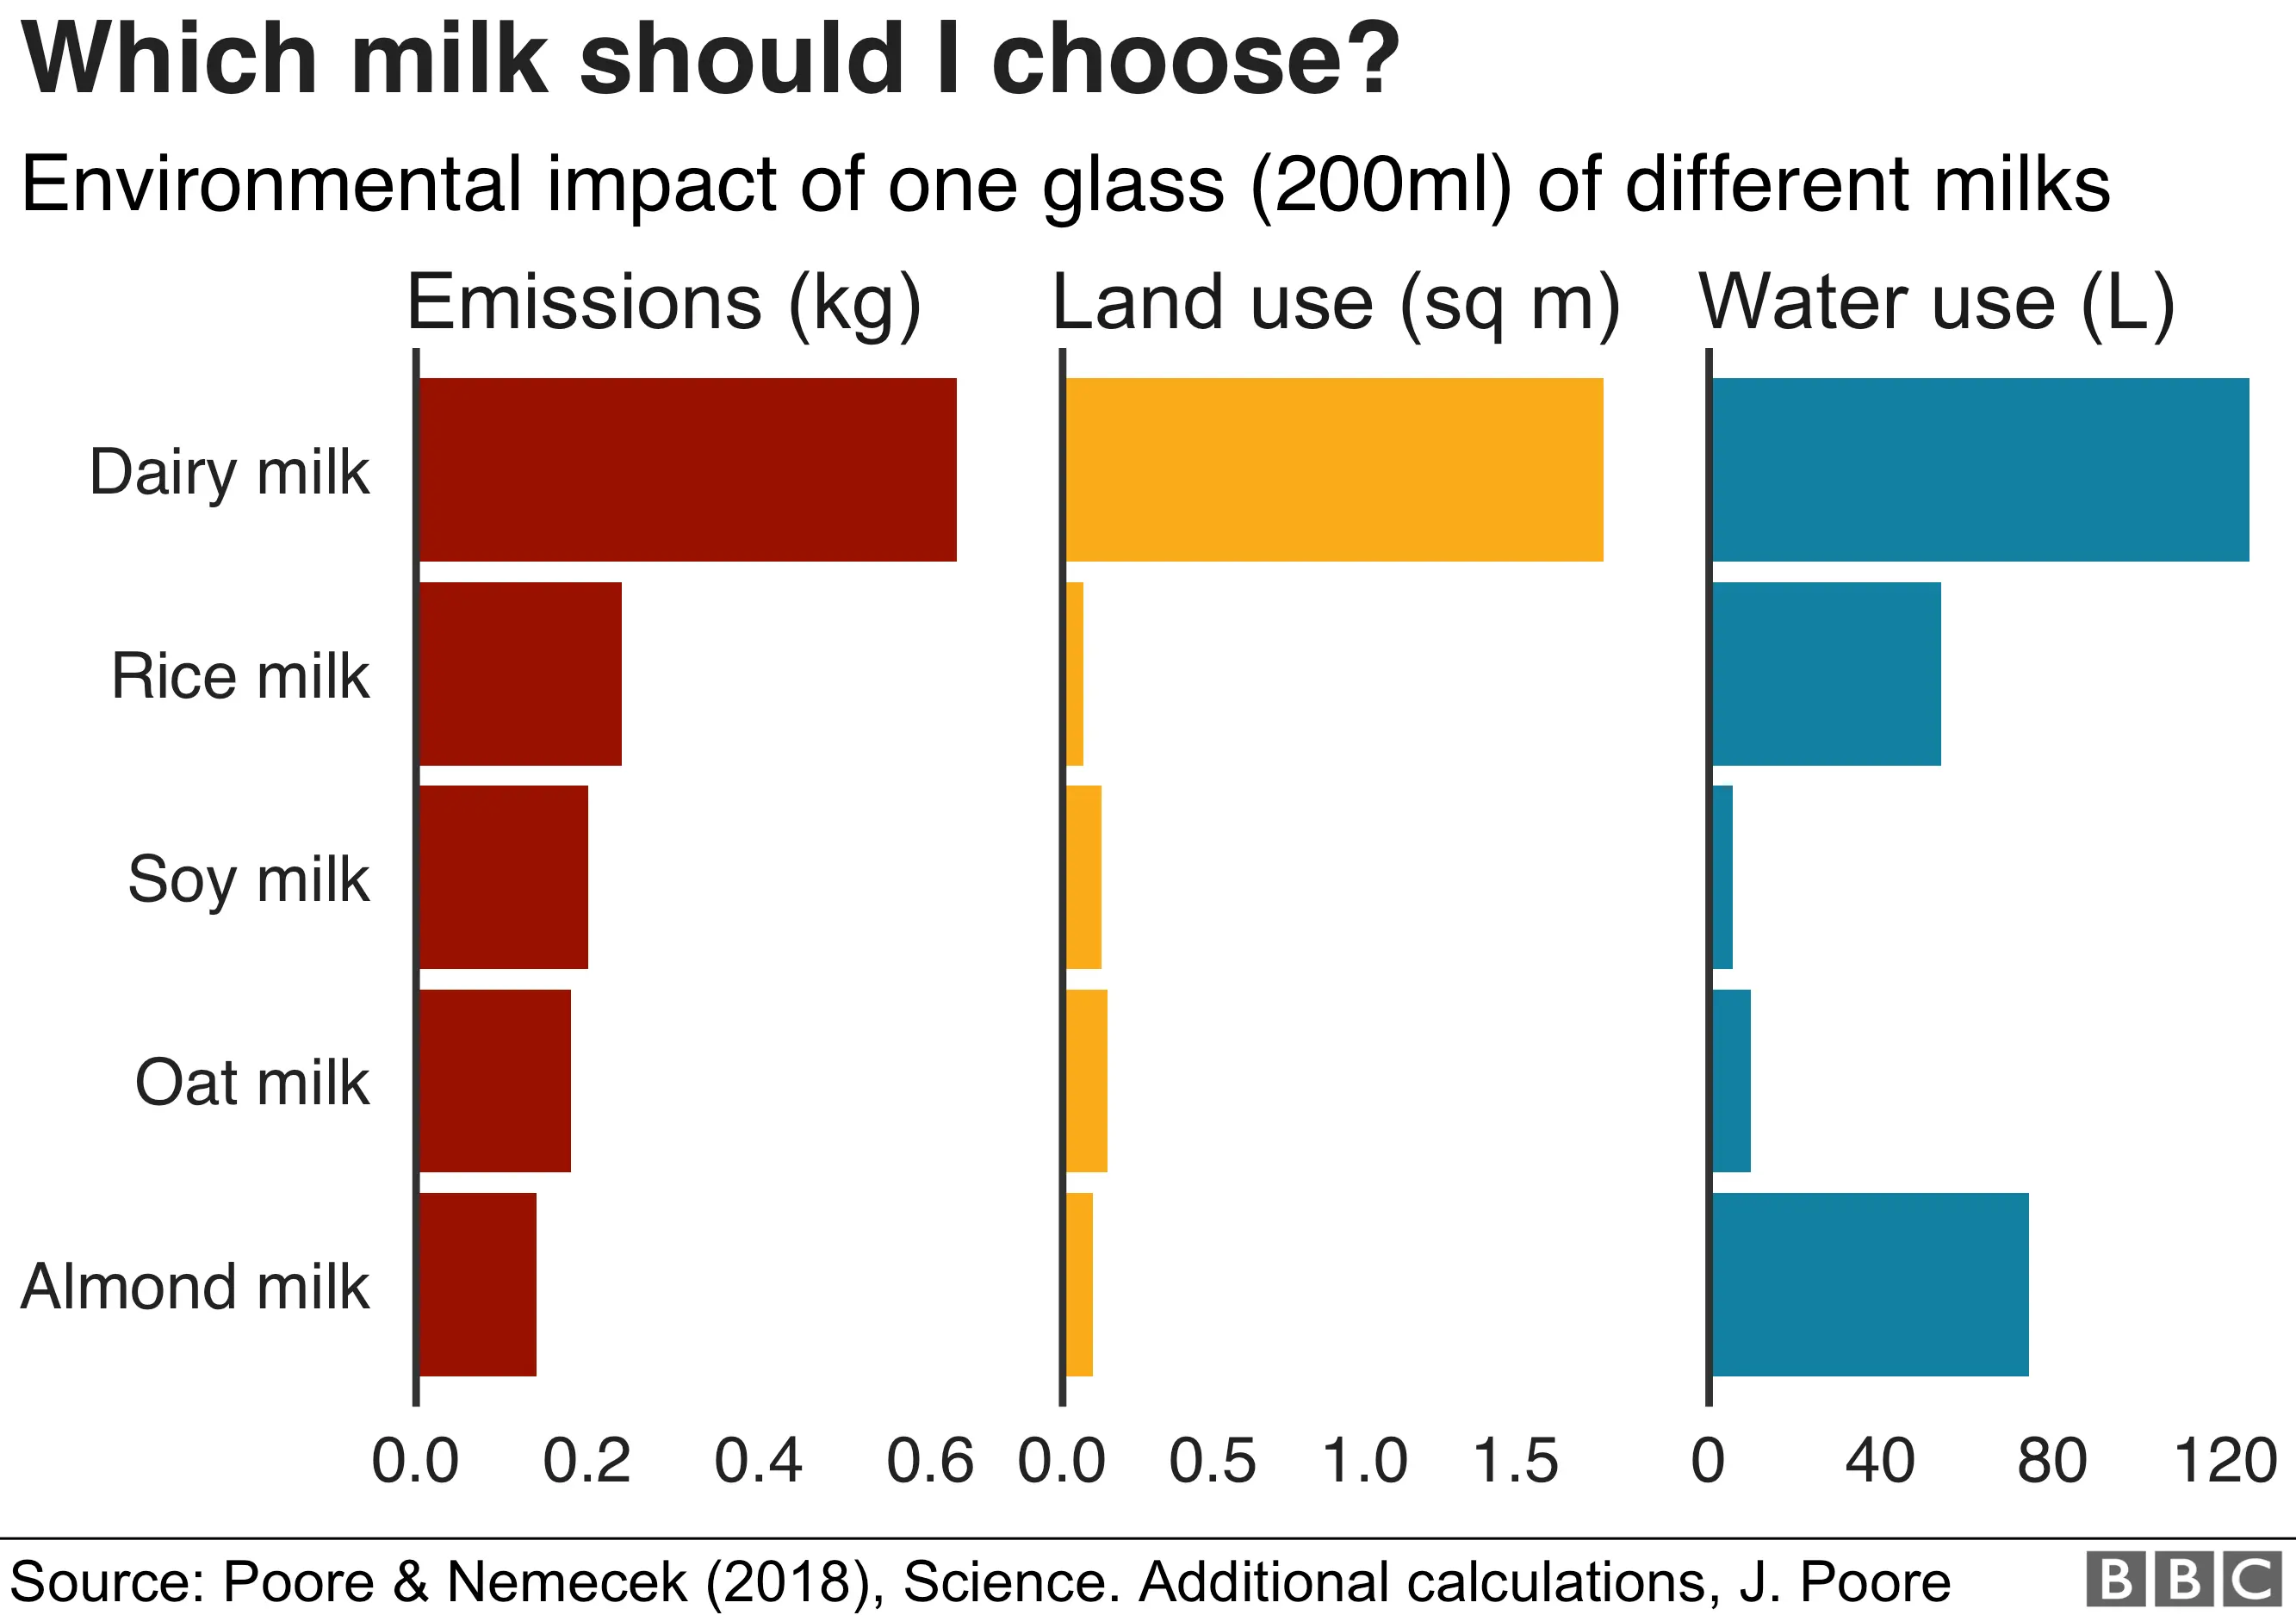
Producing a glass of dairy milk every day for a year requires 650 sq m (7,000 sq ft) of land, the equivalent of two tennis courts and more than 10 times as much as the same amount of oat milk, according to this study.
Almond milk requires more water to produce than soy or oat milk. A single glass requires 74 litres (130 pints of water) - more than a typical shower. Rice milk is also comparatively thirsty, requiring 54 litres of water per glass.
However, it's worth noting that both almond and rice milk still require less water to produce than the typical glass of dairy milk.
Where something is produced can mean there is a variation in its impact on the climate, see the chart below on dairy milk. On a more local level, sourcing products made close to home may result in a smaller carbon footprint than products that have had to be transported a long way.
The graphic below takes into account emissions from farming and in addition it includes transportation, packing and processing. Where livestock feed has had an impact on deforestation, this figure has also been included.

To find out the climate impact of what you eat and drink, choose from one of the 34 items in our calculator and pick how often you have it.
How do your food choices impact on the environment?

Don't cry because you can't play with our interactive. Update your browser to have a go!

All figures for each food in the calculator are global averages. You can read more about how it was made at the foot of this page. Read more about it here. If you cannot view the food calculator, click to launch the interactive content.
Design by Prina Shah, development by Felix Stephenson and Becky Rush.
Food production is responsible for a quarter of all human-produced greenhouse gas emissions, contributing to global warming, according to the study on which the calculator is based, by Joseph Poore, of the University of Oxford.
The research found meat and other animal products were responsible for most food-related greenhouse gas emissions, despite providing only a fifth of the calories consumed.

People tend to underestimate the greenhouse gas emissions from food, and dairy milk is no exception, according to research by Dr Adrian Camilleri, a psychologist at the University of Technology Sydney.
"The greenhouse gas emissions from milk are about 30 times higher than what people estimate," he told BBC News.
"I suspect that most consumers underestimate the greenhouse gas emissions saved by switching from dairy milk to plant-based milk such as soy milk."
Sales of so-called alternative milks are growing faster in the UK than sales of traditional milk, according to market researchers Mintel.
Searches for milk alternatives spike in January in the UK - especially soy milk and almond milk.

Oat milk companies have recently entered the UK market, giving the drink a boost in search interest. No other country in the world has had higher search interest in oat milk than the UK in the past 12 months.
Last year, a record 50,000 people signed up to the Veganuary campaign to live without animal products for a month. But the growing popularity of veganism extends beyond January. Searches for veganism have doubled in the past year.
So to what extent do plant-based diets' trendiness translate to actual numbers?
There are about 540,000 vegans in the UK, according to a 2016 survey by the Vegan Society, estimated to be up from 150,000 in 2006.
Yet, some farming bodies are critical of the idea of Veganuary.
The campaign ignores the fact sheep farming in the UK "works very much in harmony with our environment, our landscapes, and our human ecology", according to the National Sheep Association.
Red meat from livestock raised on grass was different from intensive animal farming, said chief executive Phil Stocker.
"Some people seem hell bent on portraying sheep as a global enemy - but in fact they are the ultimate in renewable technology and are an efficient form of productive land management that is planet-friendly," he added.

How did we make the calculator?
How is the environmental impact calculated?
University of Oxford researcher Joseph Poore, and Thomas Nemecek of the Agroecology and Environment Research Division in Zurich, Switzerland, looked at the environmental impact of 40 major food products that represent the vast majority of what is eaten globally.
They assessed the effect of these foods on climate-warming greenhouse gas emissions and the amount of land and fresh water used across all stages of their production, including processing, packaging, and transportation, but excluding the cooking process.
By analysing data from nearly 40,000 farms, 1,600 processors, packaging types and retailers, Poore and Nemecek were able to assess how different production practices and geographies have very different consequences on the planet.
What about serving sizes?
The data in the study looked at the environmental impact for 1kg of each of the different food products.
For this story, these were converted to impact per serving sizes based on serving sizes from the British Dietetic Association (BDA) and healthy diet portion sizes from BUPA.
The figures for serving sizes based on the BDA and BUPA suggestions are often lower than portion sizes commonly found in restaurants and what people normally expect, so the figures returned by the calculator on the impact of individuals' consumption are likely to be higher in reality.
Protein-rich foods were calculated using the impact per 100g of protein from Poore and Nemecek's research and data on protein per serving from the BDA, to avoid differences between cooked and uncooked foods.
Dairy, soy and almond milks were set to 3.3% protein, while rice and oat were standardised based on their lower protein content.
What are greenhouse gases?
The figures for greenhouse gas emissions are in kilograms of carbon dioxide equivalents (CO2eq). This is a unit that converts the impact of different kinds of greenhouse gases, like methane and nitrous oxide, to the equivalent amount of carbon dioxide.
How do you know what my diet is equal to in miles driven?
The annual impact from eating a specific food is calculated by multiplying the impact of one serving of that food by the times it is eaten in a year, based on the weekly estimates submitted by the user.
These are then compared with the emissions of other daily habits. The European Environment Agency estimates that driving a regular petrol car produces 392g of CO2eq/mile over its entire lifecycle, including emissions from the vehicle's production, fuel production and exhaust emissions per mile.
Heating the average UK home produces 2.34 tonnes of CO2eq annually, according to data from the Committee on Climate Change, and a passenger's carbon footprint for a return flight from London to Malaga is 320kg CO2eq, based on figures from the Carbon Neutral calculator.
The land used to produce the annual consumption of each food is compared with the size of a double tennis court, 261 metres squared.
The annual amount of water used is compared with a shower, based on figures suggesting the average shower lasts eight minutes and uses up 65 litres. Only "blue water", i.e. water taken out of rivers or the ground, is included in the data.
Update 22nd February 2019: This article has been updated to include more detail about the methodology used. A chart has also been added showing the environmental impact of cow's milk, broken down by region.
- Published14 January 2020
- Published4 January 2017