Iceberg 'doodles' trace climate history
- Published

It is as if a child has been doodling with large coloured crayons.
What you see are actually the great gouge marks left on the seafloor when the keel of a giant block of ice has dragged through the sediments.
The arcs and loops record the movement of the berg as it turns about, caught in the wind, currents and tides.
This "ice art" is from a stunning new collection of images that detail how glacial action has shaped the ocean floor in Earth's polar regions.
The atlas is the work of more than 250 scientists from 20 countries and represents our most comprehensive view yet of what the seabed looks like at high latitudes.
"We now have a critical mass of high-resolution imagery, of the imprints left by the action of ice," explained Dr Kelly Hogan, one the collection's editors from the British Antarctic Survey (BAS).
"We can see where the ice has been and what it's done, and this allows us to compare and contrast. Looking at what has happened in the past can help us understand what may happen in the future with modern ice sheets as they respond to climate change."
Dr Hogan is presenting the Atlas of Submarine Glacial Landforms here in Vienna at the European Geosciences Union (EGU) General Assembly.
Kelly Hogan: "Ploughmarks can tell you about the types of iceberg that have passed by"
.The book, published as a "memoir" of the Geological Society of London, has taken four years to put together.
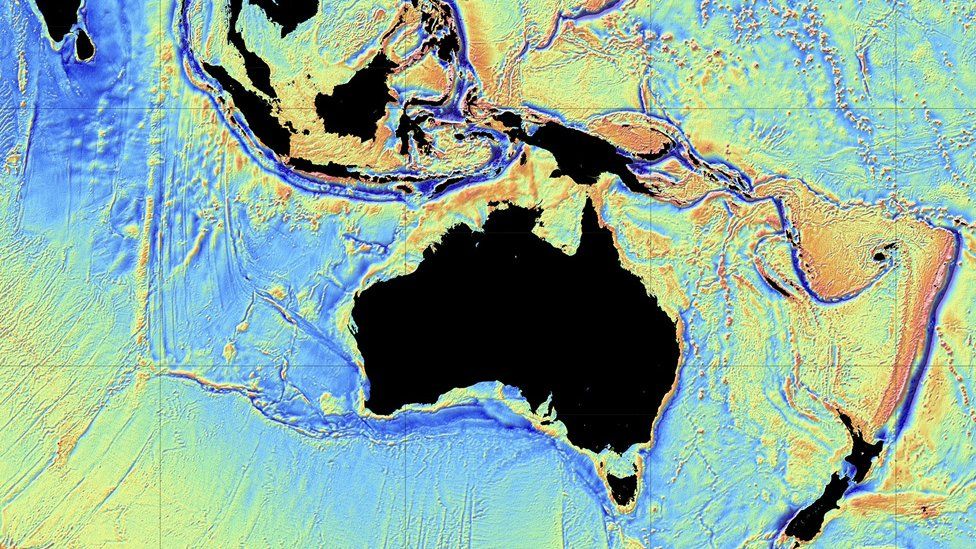
It contains mostly images produced from ship echosounders, which pulse the ocean bed and then build depth maps from the resulting return signal (the "false colours" will usual denote different depths).
A first version of the book came out in 1997, but comprised really only low-resolution data.
The new tome, on the other hand, benefits from 20 years of multibeam swath technology, which is capable of creating spectacular perspectives of the ocean floor, often at sub-metre resolution.
All ships now entering polar waters will routinely map the bed in this way.

"Today's icebreakers and ice-strengthened vessels all carry these high-res systems; they are standard. No longer do we get just single points, but a whole fan of sound goes down to the seafloor to collect 3D data. And we're finding all these weird and wonderful features," Dr Hogan told BBC News.
As well as the iceberg ploughmarks, there are the classic forms left by marine glaciers. These include long striations, drumlins (egg-shaped mounds) and moraines (sediment ridges).

"When the moraines are pushed close together, they're most likely annual features, but move a bigger distance offshore and you might find moraines that are from thousands of years ago and are spread further apart. We could go date the sediments to look at how quickly ice has retreated. So, this gives you an idea of how we can use the imagery to help us understand what is going on."
Another of the more intriguing features is the permafrost polygon. A great expanse of these shapes is captured on the floor of the Laptev Sea off the Siberian coast in the Arctic.
These were actually created above water in ground that contracted and expanded in multiple cooling and warming cycles - only then to be submerged beneath the waves.

They illustrate how the sea can sometimes preserve a record that might otherwise be lost on land, perhaps covered over by vegetation or human development, or lost entirely through erosion.
And flicking through the book, it is clear that not all ice action has been constrained to today's polar waters.
You will find, for example, images in the atlas from around the UK. But then 25,000 years ago, Britain was covered by a colossal ice sheet that extended down from the north.

Likewise, Libya makes an entry with glacial lineations in the Murzuq Basin that are several kilometres long. These ice features are present because 450 million years ago, north Africa was centred over the South Pole, forming a part of the Gondwana supercontinent.
But as impressive as all this imagery is, it still only represents a small fraction of the total seafloor currently found above 60 degrees latitude.
As with the ocean more generally across the globe, our knowledge of the shape of bed is poor. If you were to divide the polar seas into 500m boxes, more than 85% of them would have no depth soundings.
"That will change in time as all these vessels routinely gather multibeam data," said Dr Hogan.


Jonathan.Amos-INTERNET@bbc.co.uk and follow me on Twitter: @BBCAmos
- Published19 March 2017
- Published17 February 2017
- Published17 June 2016
- Published2 October 2014
- Published27 May 2014

