Coronavirus: What is the true death toll of the pandemic?
- Published

At least another 130,000 people worldwide have died during the coronavirus pandemic on top of 440,000 officially recorded deaths from the virus, according to BBC research.
A review of preliminary mortality data from 27 countries shows that in many places the number of overall deaths during the pandemic has been higher than normal, even when accounting for the virus.
These so-called "excess deaths", the number of deaths above the average, suggest the human impact of the pandemic far exceeds the official figures reported by governments around the world.
Some will be unrecorded Covid-19 victims, but others may be the result of the strain on healthcare systems and a variety of other factors.
Explore the animated guide to excess deaths below and scroll further to see how the pandemic has affected countries such as Brazil, Italy, South Africa and the UK.
An animated guide: What are excess deaths?
-
Let's use the UK as an example. If 2020 had been an average year, the dotted line in the chart below shows how many people we would have expected to die each week. This is known as expected deaths and is calculated based on the number of deaths in previous years.
-
Any deaths above those expected are known as excess deaths. During the coronavirus pandemic, many countries have recorded significantly more deaths than expected this year.
-
Many of these excess deaths can be explained by the number of people who were officially confirmed to have had Covid-19. But in many places, that does not account for all the excess deaths.
-
These other excess deaths may have been, directly or indirectly, caused by the coronavirus pandemic.
-
The total number of excess deaths shows a more complete picture of the human scale of the coronavirus outbreak.


Directly comparing the death toll between different countries is difficult. The accuracy of coronavirus data depends on how many people are tested for the virus and whether governments include deaths outside hospitals in their counts.
As the virus has spread around the world, countries have reached different stages of their outbreaks at different times. In some places, the number of excess deaths may still increase in the coming weeks and months, especially as figures are revised, while in others the number of deaths is beginning to return to normal levels.
Analysing deaths from all causes during the outbreak and comparing them with deaths in the same period from previous years can begin to provide a more accurate, if still provisional, assessment of the coronavirus pandemic's true death toll.
Read through our analysis of excess deaths in 27 locations and personal stories highlighting some of the tragic consequences of the pandemic.
Coronavirus Excess deaths

 United Kingdom (7 Mar - 5 Jun)
The number of deaths in the United Kingdom has been 43% higher than average, with about 64,500 more people dying than usual.
The UK's peak came during the week ending 17 April, with more than 12,800 excess deaths registered. According to ONS data, 9,495 of them mentioned Covid-19 on the death certificate.
London, for a long time the UK's coronavirus hotspot, has recorded the highest number of excess deaths since the outbreak began.
But all of the UK's regions have seen excess mortality, with the West Midlands and the North West registering about 50% more deaths than usual during the pandemic.
While all parts of the UK have moved past the peak, Wales and the North West of England saw the highest rates of excess deaths in the week ending 5 June.
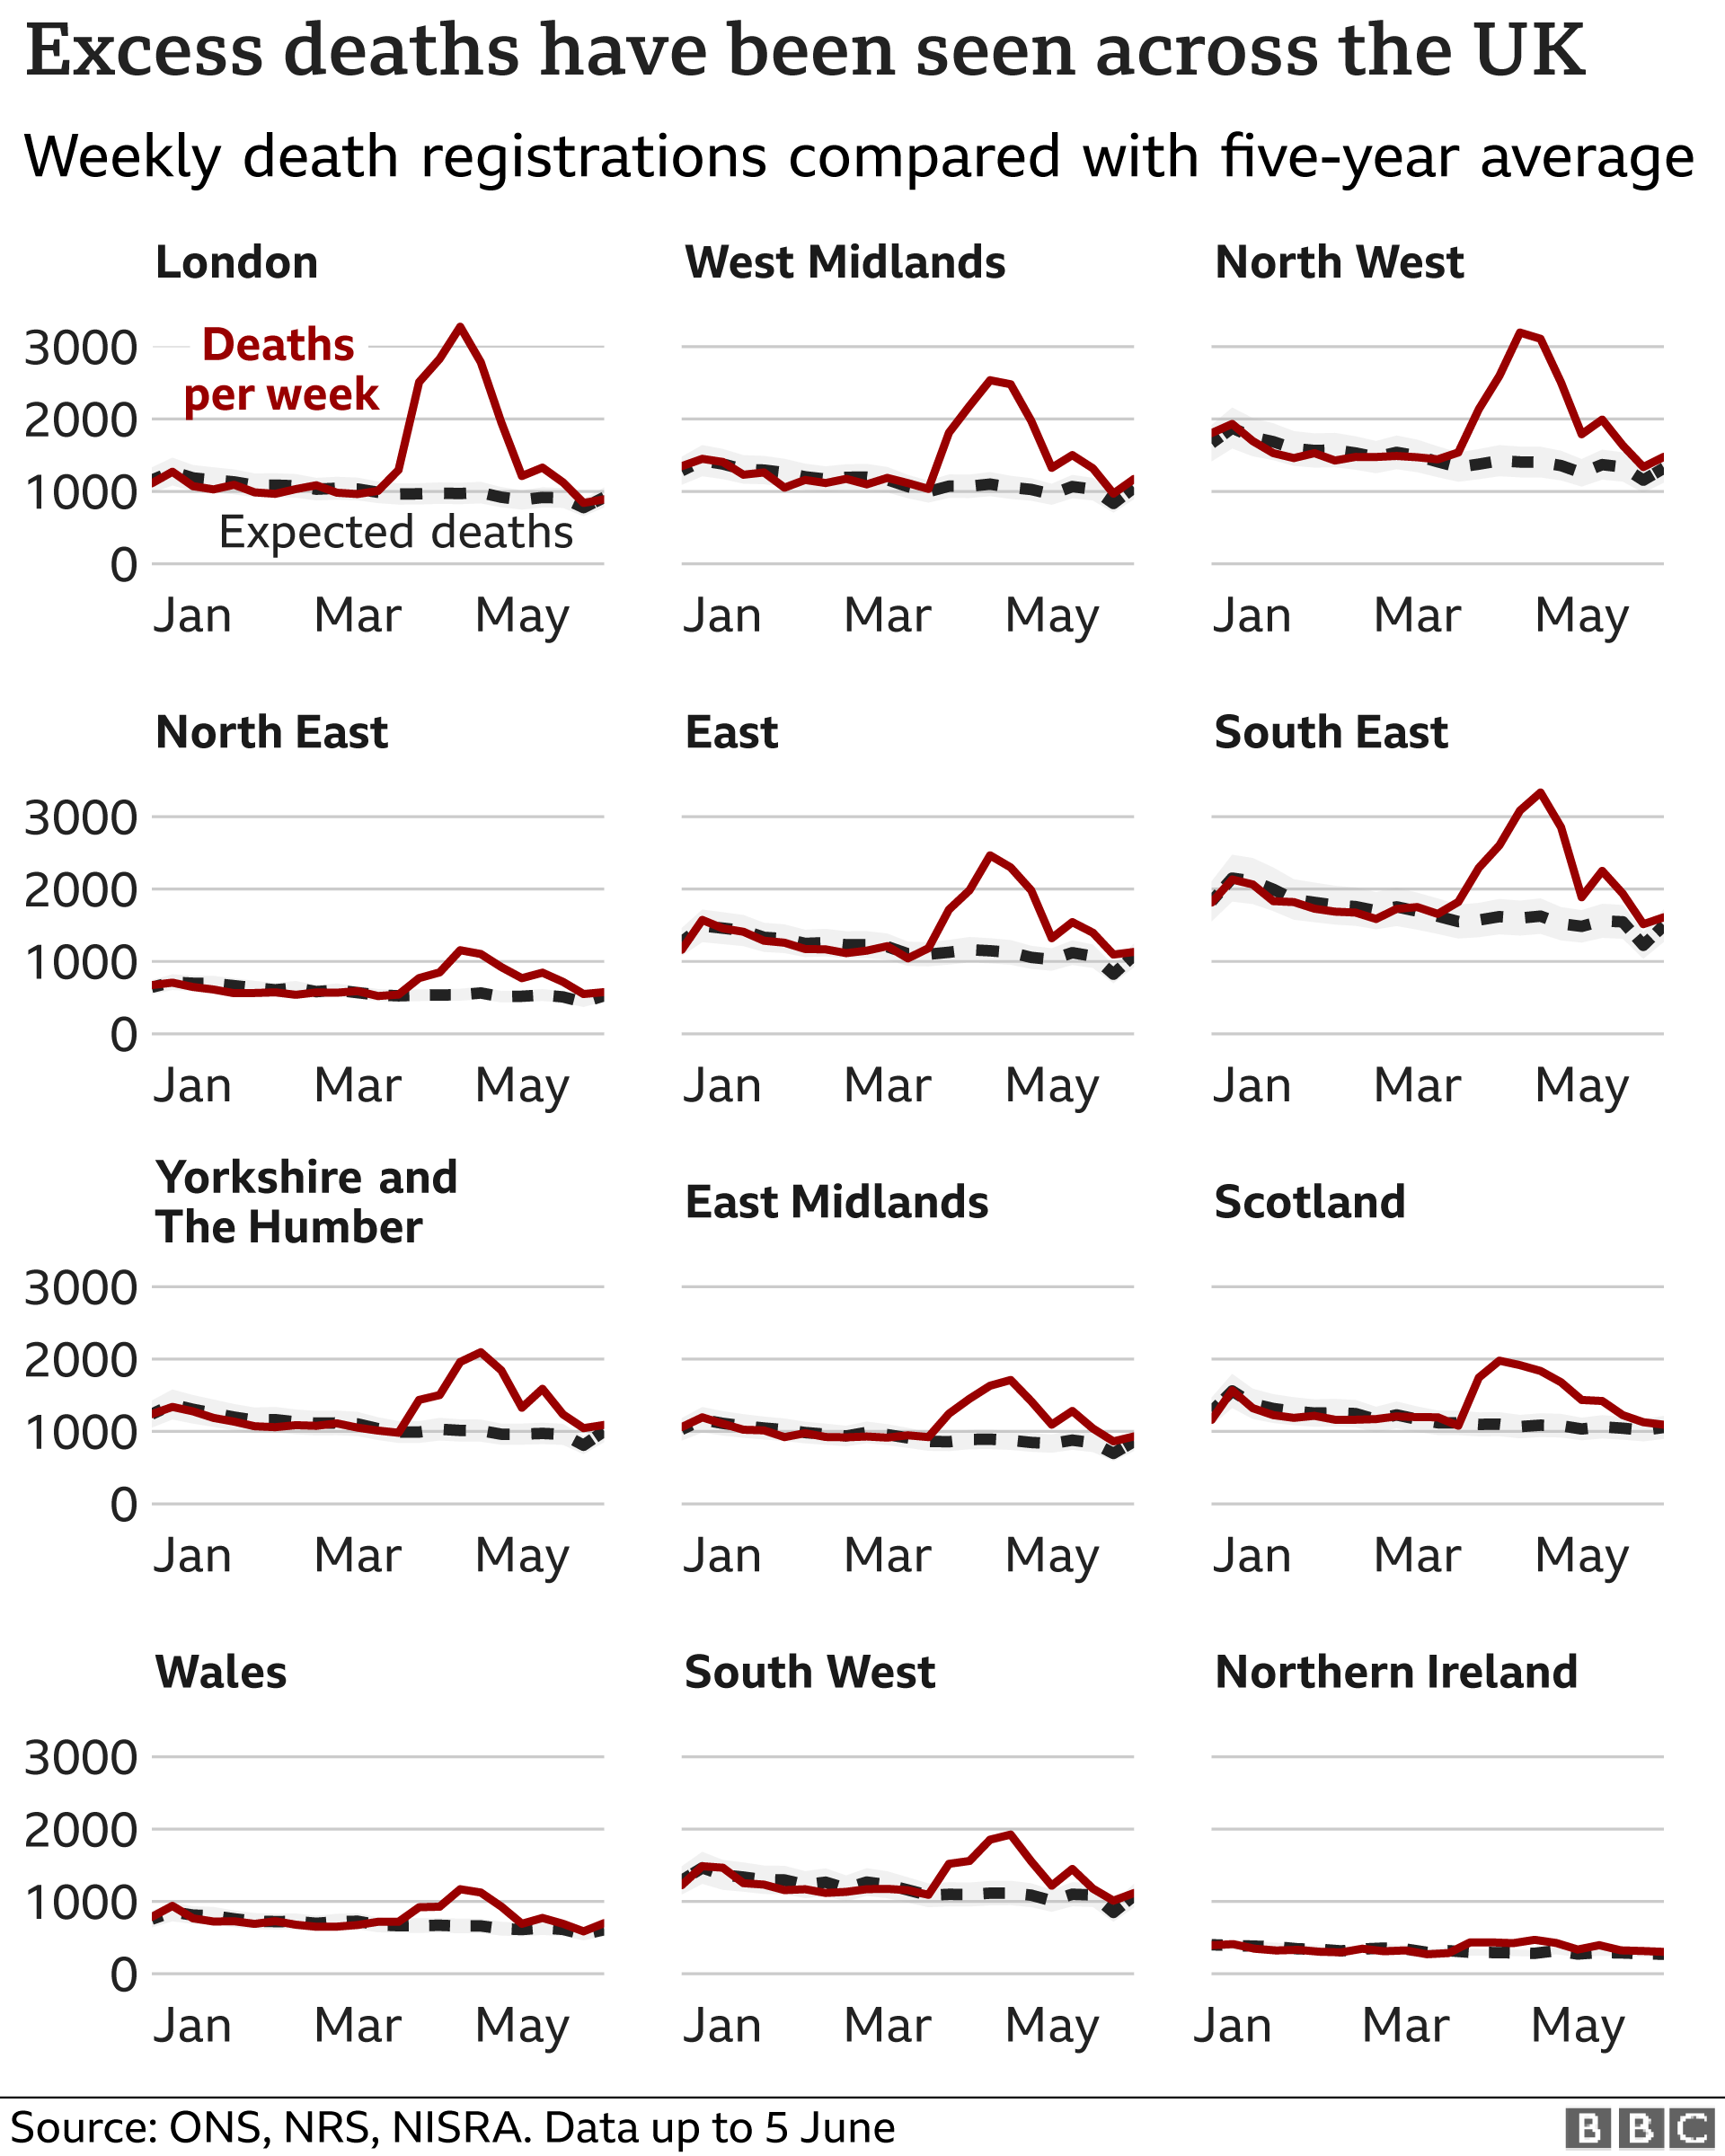
The number of UK coronavirus deaths in the totals above includes all deaths that mention Covid-19 on the death certificate.
This will differ from the total number of deaths with a positive test result announced each day by the Department of Health and Social Care.
 Austria (16 Mar - 10 May)
The number of deaths in Austria has been 11% higher than average, with about 1,300 more people dying than usual.
Above-average deaths in Austria during the country's outbreak were recorded throughout March and April, with the peak coming during the week ending 12 April.
Austria's biggest clusters of coronavirus cases were in Vorarlberg and Tyrol, where a number of ski resorts were sealed off in mid-March.
Hundreds of tourists from across Europe are believed to have become infected at these locations.
 Belgium (9 Mar - 17 May)
The number of deaths in Belgium has been 37% higher than average, with about 8,100 more people dying than usual.
Belgium is one of the world's worst-affected countries when it comes to the number of deaths recorded in relation to the size of its population.
Belgian officials say this is because of the way they are measuring deaths from Covid-19.
The country records confirmed Covid-19 deaths in hospitals and care homes, but the official tally also includes deaths in care homes that are suspected, not confirmed, as Covid-19 cases.
This is reflected in Belgium's mortality statistics - with coronavirus casualties accounting for all of its excess deaths after the first few weeks.
Belgium recorded some excess deaths at the start of the pandemic above those officially put down to the virus.
But over the course of Belgium's first wave, there were no excess deaths that could not be attributed to official Covid-19 deaths.
This means that, overall, Belgium had no other excess deaths during the period covered by the outbreak.
 6 cities* in Brazil (1 Mar - 31 May)
The number of deaths in 6 cities* in Brazil has been 38% higher than average, with about 19,300 more people dying than usual.
*The data for Brazil includes just the cities of Sao Paulo, Rio De Janeiro, Manaus, Recife, Sao Luis and Fortaleza. Expected deaths are the number of deaths recorded in the equivalent period in 2019.
Brazil has the world's second-highest overall death toll from Covid-19 and the number of fatalities are still on the rise.
The country's far-right president, Jair Bolsonaro, has received criticism at home and abroad for downplaying the escalating outbreak and flouting health advice on social distancing.
The mayor of São Paulo has said the health system in Brazil's largest city could collapse this month as demand grows for emergency beds to deal with coronavirus cases.
 Chile (23 Mar - 31 May)
The number of deaths in Chile has been 16% higher than average, with about 3,200 more people dying than usual.
Since mid-May, Chile has been reporting the third-highest number of coronavirus cases in Latin America, and a steadily rising number of deaths attributed to Covid-19.
The outbreak has hit some regions harder than others, with certain parts of Santiago Metropolitan Region bearing the greatest burden - up to half of all confirmed cases and more than half of all deaths.
 Denmark (16 Mar - 10 May)
The number of deaths in Denmark has been 4% higher than average, with about 400 more people dying than usual.
Denmark was one of the first European countries to impose a lockdown, announcing restrictions on 11 March before having recorded a coronavirus death.
The total number of deaths during its outbreak has been close to normal levels, and deaths from Covid-19 outnumber all other excess deaths during that period.
 Ecuador (1 Mar - 31 May)
The number of deaths in Ecuador has been 108% higher than average, with about 19,500 more people dying than usual.
Ecuador was one of the first Latin American countries to report a surge in coronavirus cases and deaths in early April.
In the period from March to May, more than twice as many people died in the country compared with previous years.
The number of excess deaths for these three months is five times higher than Ecuador's official Covid-19 total.
The vast majority of these above-average deaths were reported in the province of Guayas, home to the key port of Guayaquil.
It is thought that many cases have gone unreported because of Ecuador's relatively low rates of testing.
 France (2 Mar - 10 May)
The number of deaths in France has been 25% higher than average, with about 28,400 more people dying than usual.
France only included deaths from Covid-19 ocurring in hospitals at the start of its outbreak, adding deaths in care homes into its toll from early April.
The number of deaths attributed to Covid-19 have accounted for almost of all of its excess deaths since the start of France's outbreak.
 Image copyright
AFP
Image copyright
AFP
The country's peak came in the week ending 5 April, with more than 7,000 deaths above average.
France's coronavirus hotspot has been the capital city Paris and the surrounding area.
About a third of all official coronavirus deaths recorded in France have been registered in care homes, according to government figures.
 Germany (9 Mar - 10 May)
The number of deaths in Germany has been 4% higher than average, with about 7,100 more people dying than usual.
Excess deaths in Germany have been much lower than other European countries like France, Italy, Spain and the UK.
Germany's period of excess deaths spanned the weeks between 23 March and 3 May.
Its highest count of above-average fatalities occurred in the week ending 12 April, with 13% more deaths.
Over the country's entire outbreak period, deaths attributed to Covid-19 were more than the unspecified excess deaths.
 Jakarta, Indonesia (1 Mar - 31 May)
The number of deaths in Jakarta, Indonesia has been 55% higher than average, with about 4,700 more people dying than usual.
While all-cause mortality data is not available for all of Indonesia, information on the number of burials in the capital city Jakarta is a good measure of the pandemic's impact on mortality.
There were more than 4,700 burials in cemeteries in Jakarta compared with the historic average for the months of March, April and May.
The number of these excess funerals in the city is nine times higher than the official death toll from Covid-19.
Even on Indonesia's Ambon Island, where statistics show no-one has died from Covid-19, one family told us how the circumstances created by the virus cost their three-year-old son his life.
 Iran (22 Dec - 19 Mar)
The number of deaths in Iran has been 6% higher than average, with about 6,400 more people dying than usual.
Iran releases mortality statistics quarterly. The most recent figures are from the "winter" period.
It is not possible to say above-average deaths were necessarily due to the coronavirus pandemic.
Particularly over winter, with normally high death counts due to seasonal flu or severe weather, these extra deaths may have been attributed to any number of factors during the three months.
Iran's outbreak began in late February, and has already claimed the lives of several senior members of government and thousands of ordinary Iranian citizens.

As Covid-19 began to sweep across Iran, Omid was well aware of the dangers.
The 66-year-old had previously had heart and prostate conditions – so he knew his risk was high.
Omid had kept fit. He loved mountaineering, and before the outbreak he exercised daily.
"He was very careful and went into quarantine," says his son Mojeed from the north-western city of Ardabil, "but he didn't know the virus could take his life indirectly."
While self-isolating, Omid began to suffer from minor bleeding which he put down to haemorrhoids. As it became heavier, his family debated taking him to a doctor.
"It was Eid and most of the private medics were already closed under lockdown," says Mojeed. "The government hospitals were busy with Covid-19 patients and it was risky to visit."
Omid did manage to see his GP, who said further tests were needed.
The former teacher waited 20 days for private medical centres to reopen. There, doctors suspected an intestinal ulcer and advised him to go to a public hospital for an ultrasound - but his family worried, having heard all hospitals now posed a "huge risk" of Covid.
For the next month Omid remained at home without treatment. He died after a massive stroke.
Omid's family say they struggle to accept his death, particularly because he had taken such care to protect himself.
Mojeed remembers his father as friendly and funny. "He advised everyone that you should enjoy your life today because you are alive, and you don't know about the future."
 Italy (24 Feb - 26 Apr)
The number of deaths in Italy has been 40% higher than average, with about 42,900 more people dying than usual.
Note: The data for Italy is a representative sample accounting for 94% of the population.
Italy was the first country in Europe to impose a national lockdown in early March as the infection rate spiralled in the country's northern regions.
The country's outbreak was highly concentrated in the north, where a large majority of the excess deaths have been recorded.
Reported deaths in the hardest-hit region of Lombardy were more than double the number expected for the first eight weeks of the outbreak.
Other northern regions, such as Piedmont, recorded 50% more deaths than normal, while some central and southern regions actually saw fewer deaths than usual.
In Lazio, which includes the capital city of Rome, deaths were down more than 5% compared with the previous five years.
 Japan (1 Mar - 30 Mar)
The number of deaths in Japan has been 0.3% higher than average, with about 400 more people dying than usual.
Japan confirmed its first coronavirus case in January 2020, but its overall count of Covid-19 deaths remains low.
Japan has not prioritised mass testing for coronavirus, unlike its neighbour South Korea.
Yet Japan's lack of excess deaths suggests the virus has not had a major impact on the country.
 Netherlands (9 Mar - 24 May)
The number of deaths in the Netherlands has been 30% higher than average, with about 9,600 more people dying than usual.
The peak in the Netherlands came during the week ending 5 April, as the country recorded more than 5,000 deaths, some 2,000 above normal.
In recent weeks, the number of deaths in the country has returned to the level expected in an average year.
 Norway (16 Mar - 10 May)
The number of deaths in Norway has been 1% higher than average, with about 100 more people dying than usual.
Norway has recorded fewer than 250 coronavirus deaths in total.
Its preliminary mortality data indicates that deaths from all causes during its outbreak have been at normal levels, causing the number of excess deaths not attributed to coronavirus to be balanced out by official Covid-19 fatalities.
Experts have suggested that the winter flu season is likely to have been less deadly than in previous years, which may have contributed to low fatalities overall.
 Peru (16 Mar - 31 May)
The number of deaths in Peru has been 87% higher than average, with about 18,900 more people dying than usual.
According to national statistics, Peru's outbreak has spread quickly since it began in early March.
The government declared strict lockdown measures and issued nationwide safety recommendations a mere 10 days after the first case was confirmed.
Yet the country's all-cause mortality data has revealed what coronavirus statistics alone did not capture: a national death toll well above average and far greater than confirmed Covid-19 deaths alone.
 Portugal (16 Mar - 17 May)
The number of deaths in Portugal has been 15% higher than average, with about 2,800 more people dying than usual.
Portugal's excess deaths peaked during the week ending 12 April, with about 500 more deaths registered than usual.
The country's foreign minister recently said he hoped that an air bridge between the UK and Portugal could be secured by the end of June.
 Moscow and St Petersburg, Russia (1 Apr - 31 May)
The number of deaths in Moscow and St Petersburg, Russia has been 30% higher than average, with about 9,100 more people dying than usual.
Russia's national mortality data is not yet available for the period of the pandemic, but the data for its two largest cities alone reveal a pattern of excess deaths.
The capital city, Moscow, reported total death figures in April that were 17% higher than the five-year average.
In St Petersburg, the coronavirus outbreak began slightly later. Its total reported deaths for April were about as expected.
In May, both cities saw a sharp rise in reported deaths.
 Serbia (1 Mar - 30 Apr)
The number of deaths in Serbia has been 5% lower than average, with about 800 fewer people dying than usual.
Serbia's coronavirus outbreak has been relatively small, with no more than 10 deaths per day according to official statistics.
The country recorded its first death from Covid-19 on 20 March, and the next day the government rolled out harsh restrictions on movement.
It remains to be seen whether data for future months will show similar evidence of a contained outbreak.
 South Africa (25 Mar - 2 Jun)
The number of deaths in South Africa has been 9% lower than average, with about 7,400 fewer people dying than usual.
South Africa's mortality statistics look rather different to those of other nations.
The total number of reported deaths has been far below what was expected.
 Image copyright
GETTY IMAGES
Image copyright
GETTY IMAGES
President Cyril Ramaphosa declared a strict nationwide lockdown that began on 26 March, after which the country saw a significant downward shift in its weekly fatalities.
With people confined to their homes, South Africa saw fewer reported deaths from common incidents such as traffic accidents.
Epidemiologist Professor Debbie Bradshaw from the South African Medical Research Council notes: "Homicides almost halved with alcohol sales being banned.
"But at the same time we think the other infectious diseases were probably affected as well; the more usual flu or severe pneumonias that come about in winter were also slowed down."
As restrictions have eased, weekly deaths have begun to climb back to normal levels.
 South Korea (1 Feb - 30 Mar)
The number of deaths in South Korea has been 5% higher than average, with about 2,400 more people dying than usual.
South Korea confirmed its first coronavirus case on 20 January and its first death a full month later.
The country's strategy of intensive testing and contact tracing is often credited with its low number of coronavirus deaths.
The country was once reporting hundreds of new cases a day, with a large cluster identified in the city of Daegu linked to the Shincheonji Church of Jesus.
Yet on 15 April, 29 million people nationwide participated in an election with no confirmed cases traced back to the poll.
 Spain (2 Mar - 17 May)
The number of deaths in Spain has been 50% higher than average, with about 42,900 more people dying than usual.
Spain has been one of the countries worst hit in the coronavirus pandemic and endured one of Europe's most restrictive lockdowns, with children banned from going outside for six weeks.
The country hit its peak in the week ending 5 April, recording more than 11,000 excess deaths.
The Spanish government had announced just below 6,000 official deaths from Covid-19 that week.
The Madrid region has reported the highest levels of excess deaths, recording more than 2.5 times the number of expected fatalities since the outbreak began.
 Sweden (9 Mar - 17 May)
The number of deaths in Sweden has been 24% higher than average, with about 4,200 more people dying than usual.
During Sweden's peak, in the week ending 12 April, the country recorded its highest number of deaths in a single week in over two decades.
Swedish mortality figures contrast with neighbouring countries like Denmark and Norway, where total deaths have been much closer to levels seen in previous years.
Throughout its outbreak, Sweden has avoided a full lockdown and kept large parts of society open. Instead, it has relied on voluntary social distancing and other targeted measures.
 Image copyright
GETTY IMAGES
Image copyright
GETTY IMAGES
Dr Anders Tegnell, the state epidemiologist and person in charge of the country's Covid-19 response, acknowledged recently that the controversial decision not to impose a strict lockdown had led to too many deaths.
However, he insisted that "we basically still think that is the right strategy for Sweden" and described the battle against the virus as a "marathon, not a sprint".
 Switzerland (9 Mar - 24 May)
The number of deaths in Switzerland has been 10% higher than average, with about 1,400 more people dying than usual.
The peak in Switzerland's mortality came during the week ending 5 April. Some 500 more people lost their lives than normal, an increase of 39%.
Recent data suggests that the country's outbreak has been brought under control.
For the five weeks leading up to 24 May, reported numbers of deaths in Switzerland have returned to the expected range.
The number of official Covid-19 deaths in Switzerland is now greater than those excess deaths not attributed to coronavirus.
 Thailand (1 Mar - 31 May)
The number of deaths in Thailand has been 2% higher than average, with about 2,400 more people dying than usual.
Despite being the second country outside China to confirm a case of coronavirus, Thailand's official statistics have recorded a surprisingly low number of deaths from Covid-19.
A sharp rise in confirmed cases in late March led Prime Minister Prayut Chan-o-cha to declare a state of emergency, yet the coronavirus death toll never surpassed four fatalities per day.
In a similar pattern, all-cause mortality data have revealed a higher than average number of deaths in March that returned to normal levels in April and May.
 Istanbul, Turkey (16 Mar - 24 May)
The number of deaths in Istanbul, Turkey has been 32% higher than average, with about 4,500 more people dying than usual.
Note: Covid-19 deaths figures are for all of Turkey, not just Istanbul.
As the virus spread quickly throughout Turkey in March, the government ordered harsh restrictions on movement to contain it.
Istanbul's total number of reported deaths peaked in mid-April.
Covid-19 mortality figures for the city are not available, yet even when taking the total number of coronavirus deaths for the entire country, they still do not account for all of Istanbul's excess deaths during the pandemic period.
This means that the total number of excess deaths not attributed to Covid-19 in the city is likely to be much higher.
 United States (16 Feb - 2 May)
The number of deaths in the United States has been 16% higher than average, with about 97,300 more people dying than usual.
The US has reported the world's largest death toll from coronavirus.
But the way the outbreak has played out across the 50 states varies widely.
New York City's coronvirus toll has been the most dramatic, with cases and deaths higher than those of many countries.
 Image copyright
REUTERS
Image copyright
REUTERS
Yet nationwide, all states have seen the impact of the virus on their healthcare systems and the lives of their citizens.
While some states such as California acted quickly to restrict movement and try to contain the disease, others such as Wyoming have resisted strict lockdown measures.
Many state-issued directives for citizens to stay at home are currently being eased.

- THE UK DEATH TOLL: How it compares with other countries
- GLOBAL SPREAD: Tracking the pandemic
- COMPARING COUNTRIES: Why its not straightforward
- EUROPE LOCKDOWN: How is it being lifted?


There is no definitive league table of the hardest hit, but we can still make broad comparisons between the countries through the first wave.
Peru, Chile and Brazil are still dealing with growing numbers of deaths so the picture there will change rapidly over the coming weeks.
The picture is more stable in countries where the total number of deaths has peaked and is now back to, or near to, normal.
Among these countries, there's a group like the UK, Spain, Italy and Belgium who have seen deaths rise by more than 30%.
That's very different to Japan or Germany, or many other countries whose weekly deaths have stayed within about 5% of normal.
If we looked at the data slightly differently - counting deaths per head of population, or using the same number of weeks for every country - we'd get slightly different results.
And the data itself is only provisional.
So we can't produce a precise ranking of countries, but we can identify the unhappy club of hard hit countries whose membership, unfortunately, is only going to grow.
How are excess deaths measured?
To measure excess deaths, we have used mortality data showing deaths from all causes. These types of reports are often recorded and published by the central civil registry, health ministry or a country's statistical authority. They can take significant time to process and confirm, so all numbers of deaths recorded in recent months are preliminary and subject to revisions, and likely to include more deaths.
The number of excess deaths represents the total number of deaths above the historical average. These figures have not been adjusted for age, so do not take into account demographic differences across country populations.
The total number of excess deaths for each country have been rounded to the nearest hundred.
How were countries chosen?
We have focused on locations that have robust mortality data covering at least four weeks from the start of the coronavirus pandemic in that place. Where reliable data is not available at the national level, we have focused on a smaller region with complete data, such as Istanbul in Turkey. In Jakarta, Indonesia, records of burials within the city serve as a proxy for death counts.
How was the outbreak defined in each area?
The start of each location's outbreak is counted from the week or month during which it recorded its fifth official death from Covid-19. The period extends to the latest date for which there is available data that is unlikely to change significantly.
In most cases, we have calculated our baseline of expected deaths from an average of reported fatalities for the area over five years, from 2015 to 2019. Where possible, we defer to a number of expected deaths that has been modelled by the statistical authority in that country in order to account for population changes or known environmental factors.
What does 'none overall' mean?
In the charts above the term "none overall" means either that all excess deaths in this particular location have been accounted for by the official coronavirus figures, or that there have been no excess deaths there.
The figure for other excess deaths is calculated by taking the total number of excess deaths minus the sum of all Covid-19 deaths during the outbreak period in each place.
What sources were used?
Counts of official Covid-19 deaths are often sourced directly from the local government's own public reports. Where official data is not easily available, we have instead used data compiled and published by the European Centre for Disease Prevention and Control (ECDC).
For sub-national areas like Jakarta, we have used Covid-19 deaths specific to that area. For Istanbul, the available Covid-19 data is only released at the national level. This causes an underestimation of the actual number of excess deaths that are not attributed to the coronavirus in Istanbul because the number attributed to Covid-19 represents the total for the whole of Turkey.
Are there other ways to measure the virus' impact?
Comparing excess deaths to expected deaths during a country's outbreak is one of several ways to measure impact. It is a useful way of assessing the raw death toll in a place, expressed either as a number of people beyond the expected level or as a percentage above average.
But the duration of the outbreak plays a role in these calculations. For places that have a quick rise in deaths followed by a quick fall, like Spain, there will be fewer expected deaths during their outbreak period compared to places with an outbreak that lasted much longer, like the UK. The lower number of expected deaths for Spain makes its excess appear much higher in percentage terms.
Another measure is to look at the excess deaths per million of population. The benefit is that it puts countries of differing populations on a more level playing field. However, measuring by deaths per million will look worse for a country with an older or less healthy population, since it doesn't account for the fact that an ageing country would expect to see more deaths.
Sources
Statistik Austria; Belgium Mortality Monitoring; Sciensano; Belgian Institute for Health; Civil Registry of Brazil; Chile Civil Registration and Identification Service; Chile Ministry of Science, Technology, Knowledge and Innovation; Chile Ministry of Health; Statistics Denmark; Ecuador General Directorate of the Civil Registry; Ecuador National Institute of Statistics and Census (INEC); French National Institute of Statistics and Economic Study (Insee); Germany Federal Statistics Office; DKI Jakarta Provincial Park and Forest Service; Iran National Organisation for Civil Registration; Iran Ministry of Health; Italian National Institute of Statistics (Istat); Japan Bureau of Statistics; Ministry of Internal Affairs and Communications; Statistics Netherlands (CBS); Statistics Norway; Peru Ministry of Health; Peru National Information System of Deaths (SINADEF): Portugal Directorate-General for Health; Moscow Office of Civil Registration; Moscow Government; St Petersburg Office of Civil Registration; Statistical Office of the Republic of Serbia; South African Medical Research Council (SAMRC); South Africa Department of Statistics (Stats SA); Statistics Korea (KOSTAT); Institute of Health Carlos III (ISCIII), Spain; Mortality Monitoring Spain; Statistics Sweden; Federal Statistical Office Switzerland; Thailand Department of Provincial Administration; Istanbul Metropolitan Municipality; Tubitak (Scientific and Technological Research Council of Turkey); Office of National Statistics (ONS); National Records of Scotland (NRS); Northern Ireland Statistics Research Agency (NISRA); State Statistics Service of Ukraine; American Centers for Disease Control and Prevention (CDC); US National Center for Health Statistics (NCHS); European Centre for Disease Prevention and Control (ECDC)
Design by Prina Shah and Zoe Bartholomew. Development by Becky Rush and Scott Jarvis. Data analysis and writing by Becky Dale and Nassos Stylianou. World Service production by Ana Lucia Gonzalez, Louise Adamou and Paul Harris. Video production by Christian Estacio, Vincente Gaibor del Pino, Isadora Brant, Claudia La Via, Sofia Bettiza, Mark Perna, Lesthia Kertopati, Said Hatala Sotta and Anindita Pradana. Illustrations by Jilla Dastmalchi. Statistical oversight by Robert Cuffe. Project management by Sally Morales. Project production by John Walton and Jacky Martens.
Additional contributions from: Stéphane Helleringer, Associate Professor, Johns Hopkins University; Dr Bernardo Lanza Queiroz, Associate Professor of Demography, University Federal de Minas Gerais; Dr Hazhir Rahmandad, Associate Professor, MIT Sloan School of Management; Navid Ghaffarzadegan, Associate Professor, Virginia Tech University; Mesut Erzurumluoglu, Research Associate, MRC Epidemiology Unit, University of Cambridge; Dr Yu Korekawa, Director for International Research and Cooperation, National Institute of Population and Social Security Research