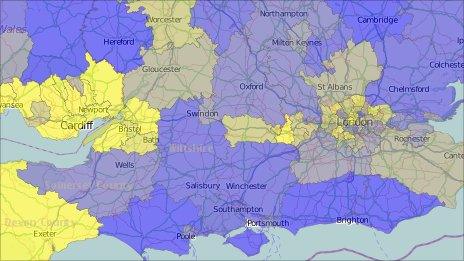
Online map compares road accident risk around Britain
- Published

A new online mapping tool has been created to allow people to find out about traffic accidents in their area.
Road Safety Analysis, based in Banbury, Oxfordshire, developed the online map so local authorities and drivers could compare different areas.
The map shows the numbers of people killed or seriously injured in each highway authority in Britain.
Director Richard Owen said it showed a "worrying discrepancy" in the level of risk.
He added: "Road users in some areas experience considerably higher risk from road traffic crashes than others who might be living just over the border.
"With the help of this sort of information, local authorities can develop a much better understanding of the risks experienced by their residents and road users, helping them to address the inequalities that many people are experiencing."
Casualty rates
Ellen Booth, from the road safety charity Brake, said: "It is a useful analytical tool to help people understand the risks that they face and for professionals to help devise local solutions."
The online map uses data from 2005-09.
During that time, more than 150,000 people were killed or seriously injured - referred to as KSIs on the map - on the country's roads, the map shows. In Oxfordshire, there were 1,772 KSIs.
When broken down per head of population, the map shows casualty rates are four times higher in the Borough of Westminster, North Yorkshire and Powys in Wales than in areas such Plymouth, East Dunbartonshire and Torfaen in South Wales.
- Published17 August 2010
- Published4 February 2010