General election poll tracker: How do the parties compare?
- Published
Check the latest opinion poll trends with the poll tracker, which measures how people say they are going to vote at the next general election.
This page is no longer being updated. You can see the latest poll tracker for the UK general election due to be called in 2024 by clicking here.
Party support: 11 December 2019
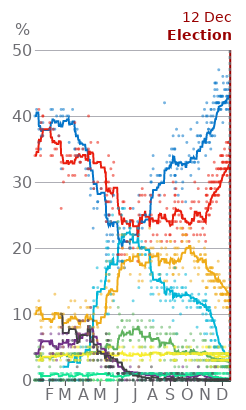
Analysis by BBC senior political analyst Peter Barnes
11 December 2019
Over the course of the campaign almost every single poll has had the Conservatives ahead by at least 6%. So if they don't end up with the most votes it would be a serious failure.
Labour have consistently been in a clear second place, a long way ahead of the Liberal Democrats in third.
The Brexit Party started the campaign at around 10% of the vote but have fallen back dramatically - in part as a result of their decision not to contest Conservative-held seats.
In Scotland the picture is very different. In the few polls there have been, the SNP has always had a commanding lead with the Conservatives in second place.
Again, if that's not the result then the polls will have been badly flawed.
For most of the campaign there have been marked differences between the polling companies. But all of them have suggested that the race has narrowed in the final two weeks.
Seat projections
What most polls don't tell us is how votes will be converted into seats in the House of Commons.
There have been several attempts to do this, though, using large polling samples which allow complex analyses of the levels of support for each party among different demographic groups.
The central forecast of the final YouGov projection is a Conservative majority of 28. But it's important to look at the range of possible outcomes their analysis implies.
For the Conservatives that range is 311-367 seats. So, on this basis, another hung parliament cannot be ruled out - and neither can a large majority.
The BBC won't report on any polls that come out on polling day so this will be the final update to the poll tracker. The exit poll, commissioned by the BBC, ITV News and Sky News will be published when voting ends at 22.00 GMT on Thursday night.


What are the parties promising you?
Compare where the parties stand on key issues like Brexit, education and the NHS.
Previous updates from Peter Barnes - 9 December 2019
Going into the last few days of the election campaign the Conservative lead over Labour remains solid.
The latest polls all put the Conservatives in the low to mid-40s and Labour in the low 30s in percentage terms across Britain as a whole.
The Lib Dems are in a narrow 11-14% range and the Brexit Party are in low single digits - a long way down compared to where they started.
Over the course of the campaign, both of the main parties have seen their poll ratings go up but the gap between the two is more or less where it was five weeks ago.
As Sir John Curtice has pointed out, if the result on Thursday is in line with these numbers then the Conservatives are probably on course for a decent majority in the House of Commons.
There should be a few more polls to come over the next three days - as well as another YouGov seat projection - so that could still change. But there would have to be a pretty big shift to point to a different overall result.
Of course, they could all be systematically wrong - it wouldn't be the first time if that turned out to be true.
But if you're using the polls as a guide to what could happen then their message is clear.
2 December 2019
The latest batch of polls lends more weight to the suggestion that the Conservative rise, which has been a consistent feature of the election campaign, has levelled off.
That doesn't mean they can't go up any further, but for the time being it seems as though support for them is fairly static.
Meanwhile, the Labour Party is still moving upwards - apparently mostly at the expense of the Liberal Democrats.
If this trend continues, then we could be on course for another election where the two biggest parties capture a very large share of the overall vote.
It would still need another big move, though, to reach the 84% that the Conservatives and Labour achieved between them in 2017.
And there are only ten days to go.
Catch up
Our poll tracker smoothes out the bumps in polling by including old polls.
Their influence decays, halving every week, but that still means our rolling average can look a little behind the latest figures.
The differences are all smaller than the margin of error, but if parties are picking up or losing share, we might be a point or two off what a simple average of the latest polls would tell you.
That's not so apparent when the parties are all moving in parallel - so we're lagging a little for everyone and the differences between parties will look similar.
But, with the Conservatives plateauing, it might take a little while before our tracker starts to show Labour catching up as the most recent polls suggest they might be.
28 November 2019
YouGov's seat projection has raised a lot of interest.
A lot of that is down to the fact that when they did the same exercise in 2017 they were pretty successful at forecasting the overall election result as well as the outcome in most individual constituencies.
Their new projection puts the Conservatives on 359 seats, Labour on 211, the SNP on 43, Lib Dems on 13 and other parties on 24. That suggests a Conservative majority of 68.
However, this still needs to be treated with caution for several reasons.
It's still based on polling which, as we know, is always subject to error. The margin of error for this model ranges from a Conservative landslide to a very slim majority.
Whilst the model uses a sophisticated technique to see how national polling trends play out in individual constituencies, it is always going to be very difficult to account for truly local factors - such as a prominent local independent candidate.
Also, some other recent polls have suggested that Labour have moved a bit closer to the Conservatives than they are in the YouGov poll.
That would clearly have an impact on the size of any overall majority, and the polls will continue to move between now and 12 December.
So, whilst the projection is certainly very interesting, it shouldn't be treated as providing a reliable forecast of what the result of the election will be.
Convergence
One other feature of the most recent polls is that, with one clear exception, there seems to be more consistency between the different polling companies.
If you look back to the beginning of October, there were very large differences between them.
Now, each of the parties seems to be performing in a fairly narrow range across the polls: the low 40s for the Conservatives; close to 30% for Labour, and the mid-teens for the Lib Dems.
The outlier is Opinium's latest poll which has the Conservatives on 47% and the Lib Dems down on 12%.
Of course, convergence doesn't mean the polls can tell us what the final result will be. There's still more than two weeks to go and the lesson from 2015 is that there can be a consistent error across nearly all polls.
25 November 2019
Overall, the polls from the last week have shown the same pattern of movement as they have throughout the campaign.
In particular, the Conservatives have gone up again in the BBC poll tracker and the Brexit Party continues to fall.
There may be the first signs in the raw polling figures, though, that the Conservative shift is beginning to level off. Several of the pollsters have them one or two points below their peak in the latest figures.
Even if their rise does stall, though, the Tories are now fairly close to the 43% they actually achieved at the 2017 election. A new Panelbase poll in Scotland also puts them only marginally below the result from last time.
However, a result along those lines wouldn't mean their vote share was approximately flat across the country.
The national figures can mask big shifts at a local level. There could still be dramatic swings in individual constituencies.
18 November 2019
Writing updates on the election campaign polls is beginning to get a bit repetitive.
Once again, the changes since last week are basically following the same pattern as we've seen before.
The Conservatives are up and Labour is also up a bit. The Brexit Party is down, and the Lib Dems are also a bit lower than before.
In fact, the Conservatives are now pushing towards the 43% they actually achieved across Britain at the general election in 2017.
As we noted last week, pollsters are adjusting their methodologies to take account of the fact that the Brexit Party has withdrawn in Conservative-held seats.
That ought to help them hold on to seats they're defending.
Perhaps slightly counterintuitively, though, it might mean Boris Johnson needs a bigger lead in the polls to be sure of winning an overall majority of MPs.
Piling on extra votes in safe Conservative constituencies, thanks to the absence of a Brexit Party candidate, probably won't translate into extra seats in the House of Commons.
Northern Ireland
A poll by LucidTalk covering the election in Northern Ireland was also published last week.
These are few and far between, and the poll was conducted before the official election campaign got underway, so it's very hard to get a good sense of any trends.
But compared to the 2017 election, the poll suggested the DUP and Sinn Fein losing vote share with the Alliance and SDLP going up.
If the actual election result goes a similar way it could mean the smaller parties making gains in terms of seats at the expense of the big two.
13 November 2019
We are starting to see the pollsters respond to the tactical voting arrangements by parties.
YouGov's latest poll removed the Brexit Party, Liberal Democrats, Green and Plaid Cymru as an option in seats where they have stood down.
The most notable, if unsurprising, effect was for the Brexit Party.
Their support roughly halved from 9% to 4% as they roughly halved the number of constituencies in which they are standing.
Other pollsters have said they will follow suit.
We can expect further changes as nominations close and it becomes clear who is standing in each constituency.
So there will be even more movements in the poll tracker over the coming weeks.
Some of it will be, as ever, down to the changing political landscape.
But some will be down to pollsters' efforts to measure that landscape more accurately.
11 November 2019
We are starting to see the pollsters respond to the tactical voting arrangements by parties.
YouGov's latest poll removed the Brexit Party, Liberal Democrats, Green and Plaid Cymru as an option in seats where they have stood down.
The most notable, if unsurprising, effect was for the Brexit Party.
Their support roughly halved from 9% to 4% as they roughly halved the number of constituencies in which they are standing.
Other pollsters have said they will follow suit.
We can expect further changes as nominations close and it becomes clear who is standing in each constituency.
So there will be even more movements in the poll tracker over the coming weeks.
Some of it will be, as ever, down to the changing political landscape.
But some will be down to pollsters' efforts to measure that landscape more accurately.
The trends that were noticeable in the polls a week ago have carried on over the last seven days.
The Conservatives have continued their steady upward progress. But the tentative signs of a Labour recovery have also become firmer.
Both parties' average scores are up, although they're still below the vote shares they recorded at the 2017 election - more than 10% below in Labour's case.
Going in the other direction, the Brexit Party are down to 9% in the BBC poll tracker - their lowest score since the party was launched in April.
And it's now clear that the Liberal Democrats have fallen away a little from where they were a month ago.
Wales and Scotland
YouGov has also published polls for Wales and Scotland.
In Wales, they have Labour up four points with the Lib Dems losing the same amount since the last poll.
Labour, on 29%, are now roughly on a par with the Conservatives on 28%.
Since there are so few Welsh polls probably the best we can say with any confidence is that it looks close between the two main parties - with Plaid Cymru, the Liberal Democrats and the Brexit Party also in a close battle for third place.
The Scotland poll gave the SNP a very large lead on 42%, with the Conservatives in a clear second place, and Labour falling to its lowest score since before the last election - just below the Lib Dems.
However, that poll was conducted more than two weeks ago, before the election was even confirmed so it's rather likely that these figures are out of date.
There can be little doubt, however, that the SNP are currently on course for a strong result.
4 November 2019
It's nearly a week now since it became clear that there would be a general election on 12 December.
There have already been eight polls conducted since then - we can expect that from now on they will be coming thick and fast.
Over the last seven days the Conservatives have continued their upward trend in the BBC poll tracker whilst the Brexit Party are still drifting downwards.
There are also some early signs of a recovery for Labour. They've hit an average of 26% - their highest figure since the first half of September.
Meanwhile the Liberal Democrats have fallen to 17% - their lowest since the start of June.
These movements are pretty small so far, though, so we will need to see if they continue in the coming days.
Is it all about Brexit?
There's no doubt that Brexit will be a major issue at this election. But as the campaign gets underway, will other policy areas come to the fore?
Opinium has found that Brexit is a more dominant subject as the campaign gets under way than it was at the last general election.
Forty per cent of people in their latest poll said it was the single issue that was most likely to influence their vote. That compares with 18% at the start of the 2017 campaign.
However, when people were asked to name the three most important issues facing the country, 59% of respondents identified health/NHS compared to only 52% for the EU/Brexit.
That's a shift compared to their recent polls where Brexit has come out on top or in equal first place.
It's possible that by campaigning on non-Brexit issues the parties will be able to influence how much weight voters give to different subjects.
Panelbase's latest poll also puts the NHS/health as the top issue.
On the other hand, Deltapoll have Britain leaving the EU clearly ahead of health. The difference here could be explained by the fact they don't namecheck the NHS in their range of options.
28 October 2019
The last few weeks have seen a gradual, further strengthening of the Conservatives' position in the polls.
In the latest poll by Opinium they hit 40% - the highest figure in a single poll since the middle of August. They've also moved up to an average of 36% in the BBC poll tracker.
In the meantime, the Liberal Democrats have fallen away a little from their party conference highpoint to settle at that 18%-ish level they've occupied for much of the autumn while the Brexit Party continue to drift downwards.
Labour's average rating has essentially stayed flat.
Scotland
Because voting intention polls are fairly scarce in Scotland, it's difficult to identify trends. But the latest Panelbase poll conducted earlier this month suggests that the SNP continues to dominate.
Comparing polls to the 2017 general election result suggests Labour and the Conservatives are on course to lose votes, the SNP are roughly level with where they were, whilst the Lib Dems could gain votes.
The SNP's share in polls has floated between 36% and 43% for the last two years.
In our GB-wide poll tracker, that translates to 4%, occasionally dropping to 3% or rising to 5% since Scotland has just under 10% of the GB population.
That's why we don't suggest a margin of error range as we do for parties that field candidates across the whole of Great Britain.
Wales
Polls are even rarer in Wales - but the latest from YouGov, also conducted earlier this month, broadly matches others from earlier in the year.
The Conservatives are down from their 2017 election share but Labour has fallen back much more dramatically. From the 49% they achieved then, their share of the vote has approximately halved according to polls.
The Lib Dems are up sharply and the Brexit Party are performing far more strongly than UKIP did when voters last had their say.
Methodology: How was the poll tracker chart put together?
What is a poll tracker?
Our poll tracker lines show an average of results from the polls to date.
Each dot in the chart above shows one poll result for a party.
There are too many individual dots to keep track of: even on one day there can be very different results for one party from different polls.
So we summarise all that information with a line that averages those results.
It bounces around less and makes it easier to tell the signal from the noise (or the trends from the blips?).
Which polls do we use?
We use polls conducted by members of the British Polling Council.
As of September 2019, that's BMG, ComRes, Deltapoll, Hanbury, ICM, Ipsos Mori, Kantar, Opinium, ORB, Panelbase, Sky Data, Survation and YouGov.
Most of the polls included cover Great Britain, although some do poll the whole of the UK, but as a result we do not have separate data for parties that only stand in Northern Ireland.
We use results that exclude or downweight those who are unlikely to vote and people who do not express a preference.
We include data that are in the public domain: some polling companies will not publish all data for all parties at the same time and so we update the poll tracker as data become available.
What is the margin of error?
The margin of error is plus or minus four percentage points.
This means that there's a 90% chance that an election held tomorrow would give national vote shares within four points of our estimates for each of the parties.
And there's a 10% chance that it would be outside that range. We base these figures on a British Polling Council analysis of the results of the final set of polls before each of the elections from 2001 to 2017.
What about parties that only campaign in Scotland or Wales or stand only in a few seats?
The approach mentioned above doesn't quite work for parties that only run in Scotland or Wales or are standing in only a few seats, like UKIP or The Independent Group for Change. The electorate they are appealing to is smaller and this makes their possible vote smaller when it is projected across Great Britain or the whole of the UK.
This also means that their margin of error is smaller than that of those parties that stand across Britain and is likely to be less than + / - 1%.
How do we average the polls?
Our estimate of a party's support is a rolling average of polls to date. Bigger and more recent polls have more influence on our figures.
We also limit the influence of any one poll or of those polling firms who poll very frequently to prevent our results being too dependent on one source.
In a little more detail: the average is weighted by sample size. The more people polled in a particular survey, the more weight we will give it, up to a threshold of 2,000 people.
On the other hand, the older a poll is the less influence it has on the average figure we calculate. We also give less value to any polling firm that has data for more than 5,000 people in a fortnight. A typical poll may cover about 1,000 people.
Why is there a margin of error?
Because a party isn't guaranteed to get the same vote share in an election as it did in a poll the previous day.
Polling a sample of the population has often been likened to tasting soup. If the soup has been well stirred then you need to have only one spoonful to get a sense of what the whole bowl is like.
In the same way, a well-conducted poll of 1,000 people can, most of the time, give us an idea of what the country as a whole is thinking.
But it's not 100% precise, so, the margin of error gives a sense of how the results might change with a different sample of 1,000 people.
This margin of error only applies to national vote share: converting that into seats in Parliament is much harder and less precise.
Why do polling companies give such different answers?
There are also systematic differences between polling companies who approach people in different ways, who ask different questions and who analyse the results differently.
We list the main polling firms and the questions they ask below. Polling companies also analyse their data differently. They make choices about how to weight each respondent.
For example, if a poll of 1,000 people is made up of 550 men and 450 women, it is unrepresentative because it does not reflect the profile of the UK population (51% female).
So the answers of female respondents should be given slightly more weight than male respondents in the analysis so that the final results are 51% based on female answers rather than 45%.
That's not controversial, but adjusting for past vote or likelihood to vote is harder. Some pollsters ask respondents who they voted for last time and weight the sample to try and ensure it matches the political make-up of the general population.
One problem with doing this is that a certain number of people will incorrectly recall who they voted for last time - and a few will even lie about it. So polling companies often use a variety of further methods to improve the accuracy of their weighting.
That variety of methods leads to a variety of answers. Most companies then weight or filter by likelihood to vote so that the answers of people who are most likely to vote are given the most prominence in the results.
Finally, several pollsters reallocate a percentage of "don't knows" to the party they voted for last time. This is to get around the problem that emerged following the 1979 election with the phenomenon of "shy Tories" or the "spiral of silence" - people who do not want to discuss their voting preference but who will still vote.
Our approach, excluding "don't knows" from our polltracker, is slightly different.
It is like saying that they won't vote or, if they did, their voting preferences would look quite like those who do express a preference.
Questions asked by each pollster:
Many polling companies changed their methodology when the candidates lists were released to account for those parties that are standing only in a few seats.
BMG
If a general election were held today, which of the following parties would you vote for?
Conservative, Labour, Liberal Democrat, SNP (if living in Scotland), Plaid Cymru (if living in Wales), Green Party, Brexit Party, another party
Prior to August 2019, Green Party and Brexit Party were only prompted for if the respondent answered "another party". Following a randomised controlled trial, BMG decided to move those two parties into the main prompt list. The Independent Group for Change and UKIP remain in the secondary prompt list.
ComRes
If there were a (UK) general election tomorrow to elect MPs to Westminster, would you vote Conservative, Labour, Liberal Democrat, Brexit Party, SNP, Plaid Cymru, or for another party?
Deltapoll
If there were a general election held tomorrow, which party would you vote for? SELECT ONE: Conservative, Labour, Liberal Democrat, UK Independence Party (UKIP), Scottish National Party (SNP), Plaid Cymru (PC), Brexit Party, Green, Some other party
Hanbury Strategy
If a general election is held in October before the Brexit deadline of 31 October, which party would you vote for?
ICM
If there were a general election tomorrow, which party would you vote for?
Ipsos Mori
How would you vote if there were a general election tomorrow?
Kantar Public
Voting intention for next general election - online pre-coded list: Conservative, Labour, Liberal Democrats, UKIP, Green, SNP, Plaid Cymru
- Note: Brexit Party and The Independent Group for Change were not included in the pre-coded list but respondents had opportunity to select subsequently
Opinium
If there were a general election tomorrow, for which party would you vote?
ORB
If there were an election tomorrow, which party would you vote for?
Labour Party, Conservative Party, Brexit Party, Liberal Democrat, The Independent Group, UKIP, Green Party, SNP, DUP, Plaid Cymru, Sinn Fein, Ulster Unionist Party, Women's Equality Party.
Panelbase
Who would you vote for if a UK Parliamentary election took place tomorrow?
Conservative, Labour, Liberal Democrat, The Brexit Party, SNP, Green, Change UK (The Independent Group), UKIP, Other.
Sky Data
If there was a general election tomorrow and candidates for all parties were standing in your constituency, including the new "Independent Group" of former Labour MPs who have split from the Labour Party, how would you vote? Conservatives, Labour, Independent Group, Liberal Democrats, Other, UKIP, Green Party, SNP, Plaid Cymru
Survation
Respondents were asked who they would be most likely to vote for if that election were tomorrow, with the responses "Labour", "Conservative", "Liberal Democrat" prompted in a randomising order, and other parties displayed if respondents selected "Another Party".
YouGov
If there were a general election held tomorrow, which party would you vote for?
Conservative, Labour, Liberal Democrat, Scottish National Party (SNP), Plaid Cymru, Brexit Party, Green, Some other party (if this answer selected then respondents are prompted the following: UK Independence Party (UKIP), Women's Equality Party, Independent Group for Change).
Credits
Produced by Irene de la Torre Arenas, Debie Loizou, Becky Rush, Steven Connor, Tom Francis-Winnington, Alexander Ivanov, Felix Stephenson, Robert Cuffe, John Walton and Ed LowtherThe dates in the table above show the final day of fieldwork for each poll.