European Election 2019: UK results in maps and charts
- Published
It was a tough night for both Labour and the Conservatives.
The Brexit Party swept across Britain, and the Liberal Democrats and Green Party also made gains.

The Brexit Party topped polls in every country or region apart from London, which was won by the Liberal Democrats; Scotland, which was won by the SNP; and Northern Ireland, where they did not stand.
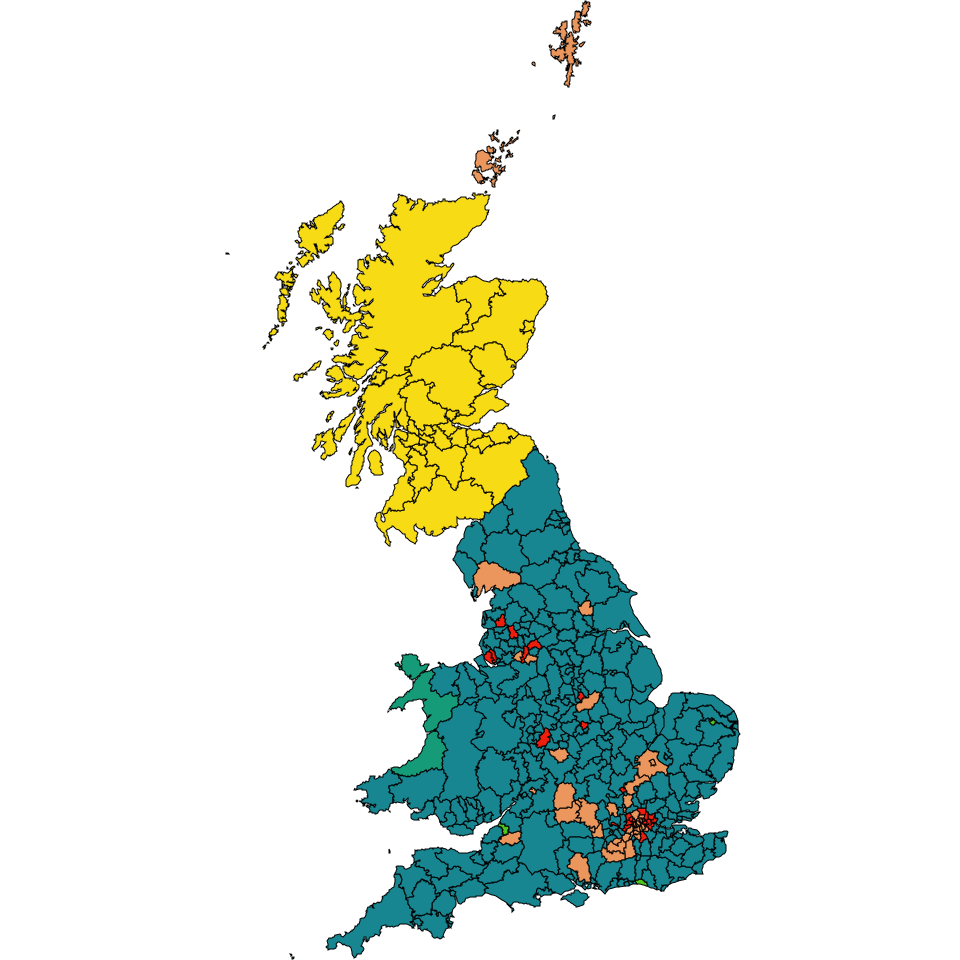
Our map by council results shows that the Brexit Party topped polls almost everywhere in England and Wales.
The Conservatives did not come top in any council areas.
Nigel Farage's Brexit Party secured more than half the vote in areas where more than 7 in 10 people backed Brexit in the 2016 referendum, while the trends for the Greens and Lib Dems were the opposite.

As for the two main parties, Labour particularly struggled to pick up votes in areas that voted strongly for Leave in 2016, averaging less than one in ten votes in those local authorities.
The Conservatives performed badly across the board, but worst in areas where voters heavily backed Remain in the referendum.

Voters in local authority areas which backed Remain in the EU referendum showed a renewed enthusiasm for getting out to vote.
For example, turnout in Bristol, in which more than 60% of voters supported Remain, increased by eight percentage points with the Green Party winning the most votes, and in Edinburgh, where more than 75% of voters were Remainers, it was up by nine points with the SNP in the lead.
On average turnout was 36.7%, up a little less than two percentage points on the last EU election in 2014.
The Conservatives and Labour combined received less than 25% of the votes, their worst result in any EU election.
The two main parties' vote share has been dropping consistently since the UK's first EU election in 1979.

By Daniel Dunford, John Walton, Clara Guibourg, Ed Lowther and Paul Sargeant. Design by Sean Willmott, Prina Shah and Irene de la Torre Arenas. Development by Joe Reed, Becky Rush and Shilpa Saraf.
Correction 20 August 2019: This article has been amended to remove a chart that attempted to show the performance of pro- and anti-Brexit parties, after a ruling from the BBC's Executive Complaints Unit.