Election 2015: Maps of turnout and party strength
- Published
The Conservatives have won 331 seats, securing a parliamentary majority of 12 after all 650 constituencies declared. They have made a net gain of 24 seats and their share of the vote increased by 0.8%.
Labour have seen their share of the vote increase more than the Conservatives, up 1.5% but they have made a net loss of 26 seats, mainly due to the advances made by the Scottish National Party.

The interactive maps below show the share of the vote won by each party regardless of whether they won in that particular seat. You can select Conservative, Labour, UKIP, Lib Dem, SNP, the Greens and Plaid Cymru from the dropdown menu.
Your browser does not support this interactive content

Tap here , externalfor the interactive map.
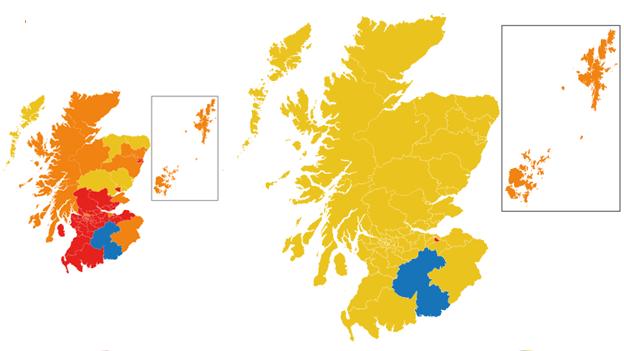
SNP surge

A total of 50 of Scotland's 59 seats changed hands in an unprecedented shift to the SNP at the polls.
Nicola Sturgeon's party now has 56 MPs while Labour and the Lib Dems have seen their standing slashed to one seat each. The Conservatives retain their single seat.
More on Scotland's dramatic political transformation here.
Lib Dem collapse

The Conservatives swept to victory across the South West, wiping out Liberal Democrat representation in the region.
The Lib Dems lost all 15 of their seats, including North Devon, a constituency that they had held for the past 23 years.
Cornwall's six constituencies all returned Conservative MPs. Ten years ago they had all gone to the Liberal Democrats.
Capital battleground

Labour bucked the national trend in London, gaining seven seats and increasing their number of MPs in London to 45 out of 73.
The Lib Dems were almost wiped out in the capital, losing all but one of their London MPs. Carshalton and Wallington Liberal Democrat MP Tom Brake was the only party member to hold on to his seat.
The most high-profile scalp came in Twickenham, external, where Business Secretary Vince Cable, Lib Dem MP since 1997, lost his seat to Conservative rival Tania Mathias by more than 2,000 votes. In the last election in 2010, Mr. Cable won by a majority of 12,140 votes.

Tory dominance

The Conservatives strengthened their dominance in the South East while holding UKIP at bay in key marginals in the region.
UKIP leader Nigel Farage failed to gain the seat of Thanet South, despite his party's share of the vote across the UK rising by 9.5 percentage points. Mark Reckless also lost out on a seat to Tory candidate Kelly Tolhurst in Rochester and Strood by 16,009 votes to 23,142.
The Lib Dems lost all four of their 2010 seats in the South East. In the Green Party's only seat of Brighton Pavilion, Caroline Lucas increased her majority.
Who turned out to vote?
Turnout at this general election was 66.1%. This compares with 65.1% in 2010.
Turnout was particularly high in Scotland at 71.1%, as the map below shows. The Scottish National Party made historic gains and took all but three seats.
Two seats have seen turnout rise above 80%, Dunbartonshire East and Renfrewshire East, both seats were gains for the SNP.
Your browser does not support this interactive content

Turnout in the general election in 2015 was 66.1%, which is 1% higher than in 2010
2015 election results map

Conservatives got 11.3 million votes and Labour 9.3 million - in third place was UKIP with 3.8 million
Produced by John Walton, Nassos Stylianou, Aidan Fewster, Richard Bangay, Emily Maguire and James Offer
- Published8 May 2015
- Published8 May 2015